The Pinterest report in Social Tracker allows you to compare your audience against your competitors.
Pinterest report can track only audience metrics due to the official Pinterest API limitation.
Settings and Navigation
By default, the Social Tracker shows your company’s data for the past 30 days. You can switch between companies and choose a different date range with Company and Dates filters: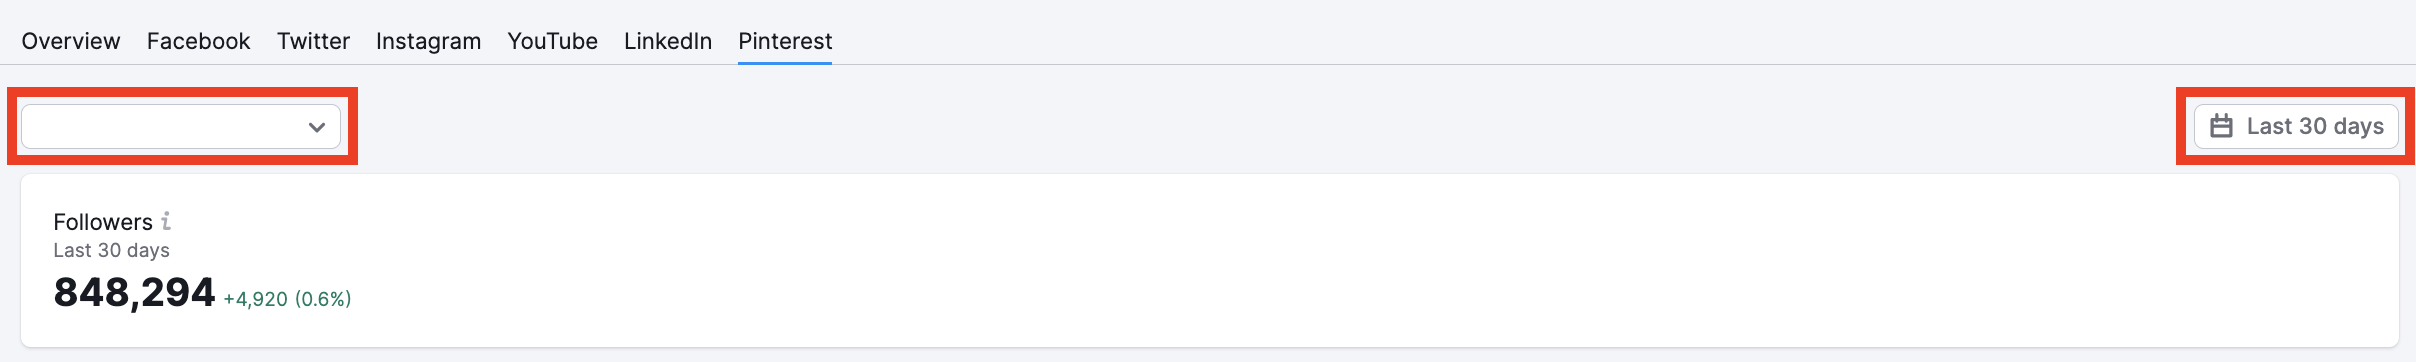
Audience
The four numbers at the top of the article show your page's total follower count over the chosen time period (the beginning and end of the date range), the change in the total follower count over the given time, and the percentage it grew since the beginning of the date range.
Below, you can find the Followers Trend, which displays your followers in line and bar graphs:
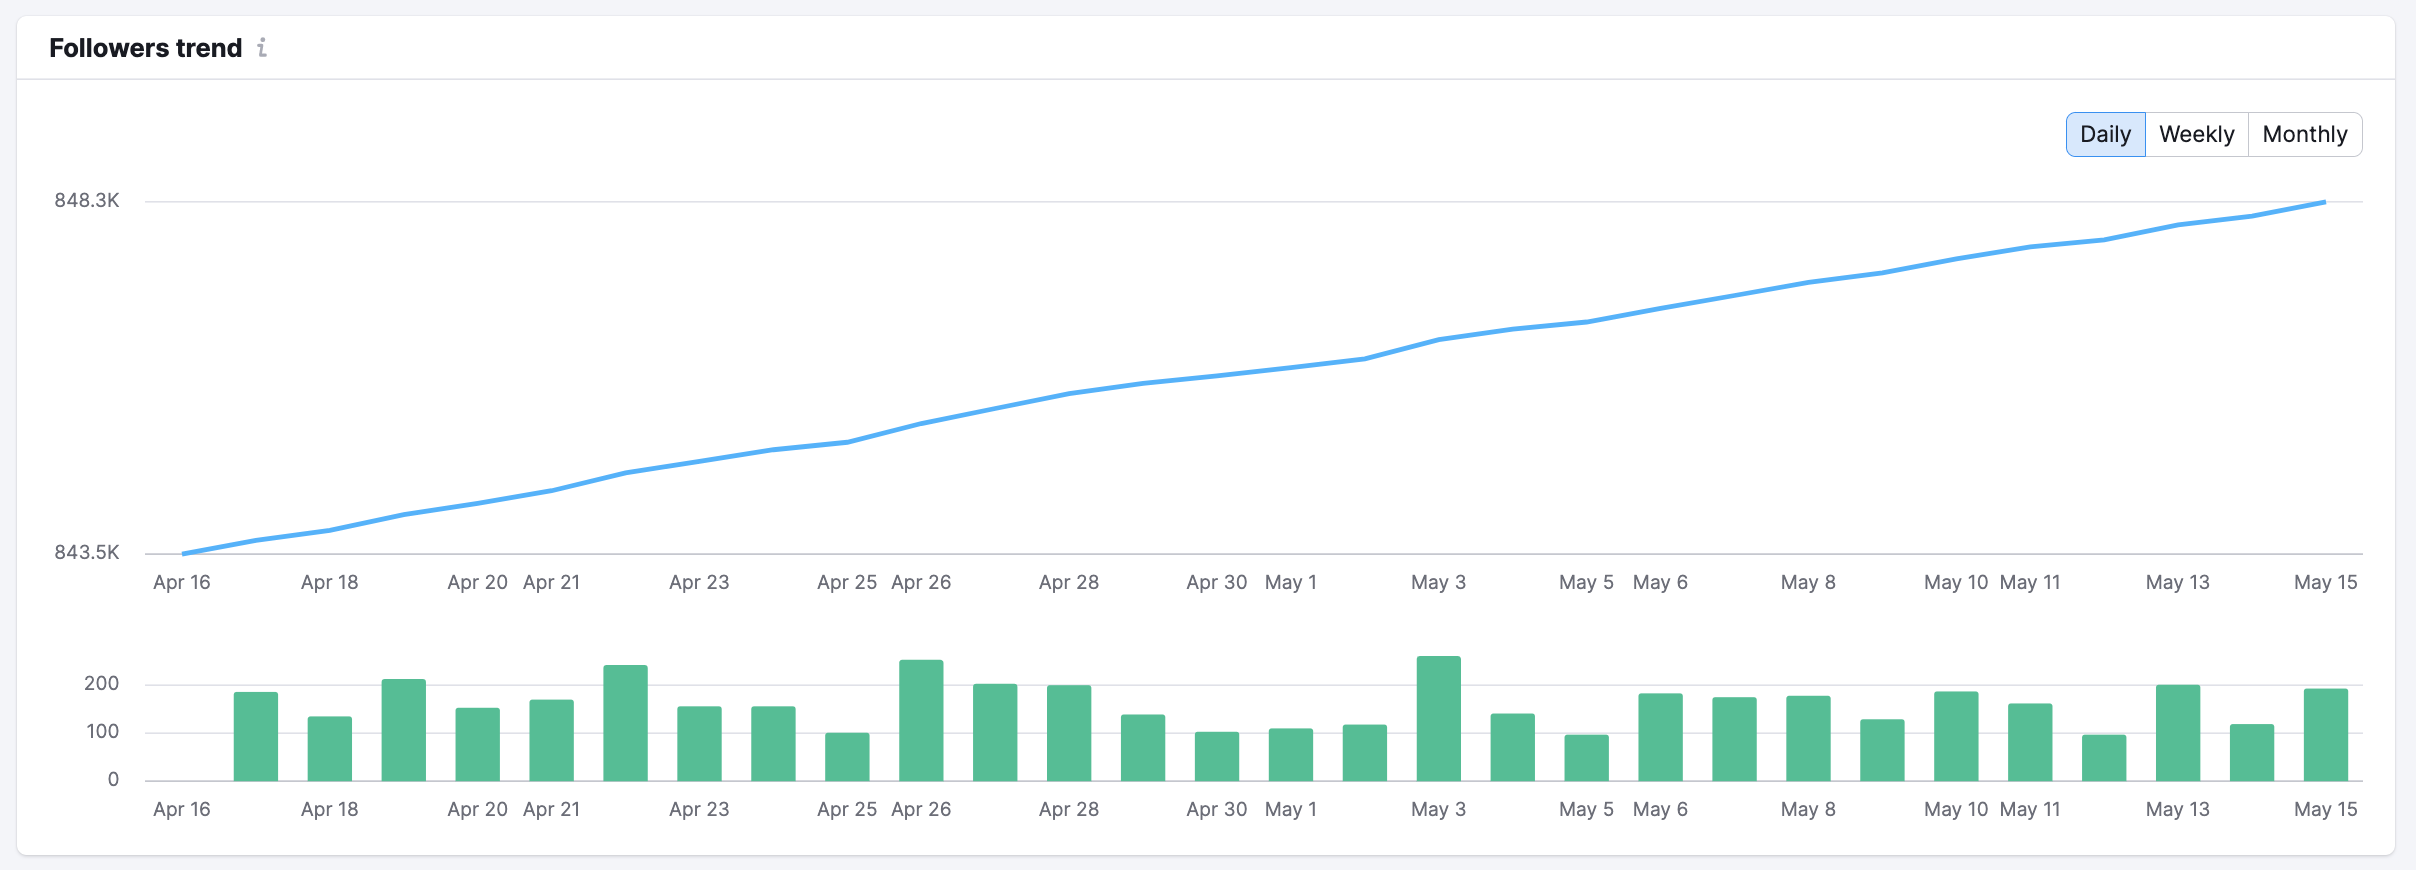 This graph can be sorted by daily, weekly, or monthly figures. Hover over a specific day to see the exact number of followers, as well as the number of followers, changed since the start of the date frame.
Comparing Your Competitors
The next section of the report allows you to compare your audience growth against competitors.
Followers trend compared to competitors - shows how the number of total Pinterest followers changed over the selected time period as compared to competitors. This can also be broken down into daily, weekly, and monthly data, and you can exclude competitors by clicking on checkboxes below the graph.
Total followers compared to competitor chart allows you to compare Pinterest followers across all the competitors. Sort by change or growth to compare Pinterest followers change over the selected time period: