
What Is Psychographic Segmentation?
Psychographic segmentation in marketing is a form of market segmentation where you group consumers into segments based on criteria. Like consumers’ personalities, interests, and social statuses.
Why Is Psychographic Segmentation Useful?
Psychographic market segmentation helps you create detailed buyer personas (a fictional profile of your ideal customer).
And gives you a deep understanding of your audience.
That deep understanding helps your business perform several activities that can improve your business.
Improve Messaging
Understanding consumer interests helps you improve your messaging. Like the copy for your ads. Or the content in your blog posts.
For example, say you own a fitness apparel brand. And you discover through psychographic research that a large segment of your audience likes to hike.
In your messaging, you can reference how your apparel is made from material that keeps hikers cool.
This callout can help your brand relate deeply to your consumer.
Tailor Your Marketing Funnel
Your marketing funnel is a simplified approach for how people become aware of your brand and turn to customers.
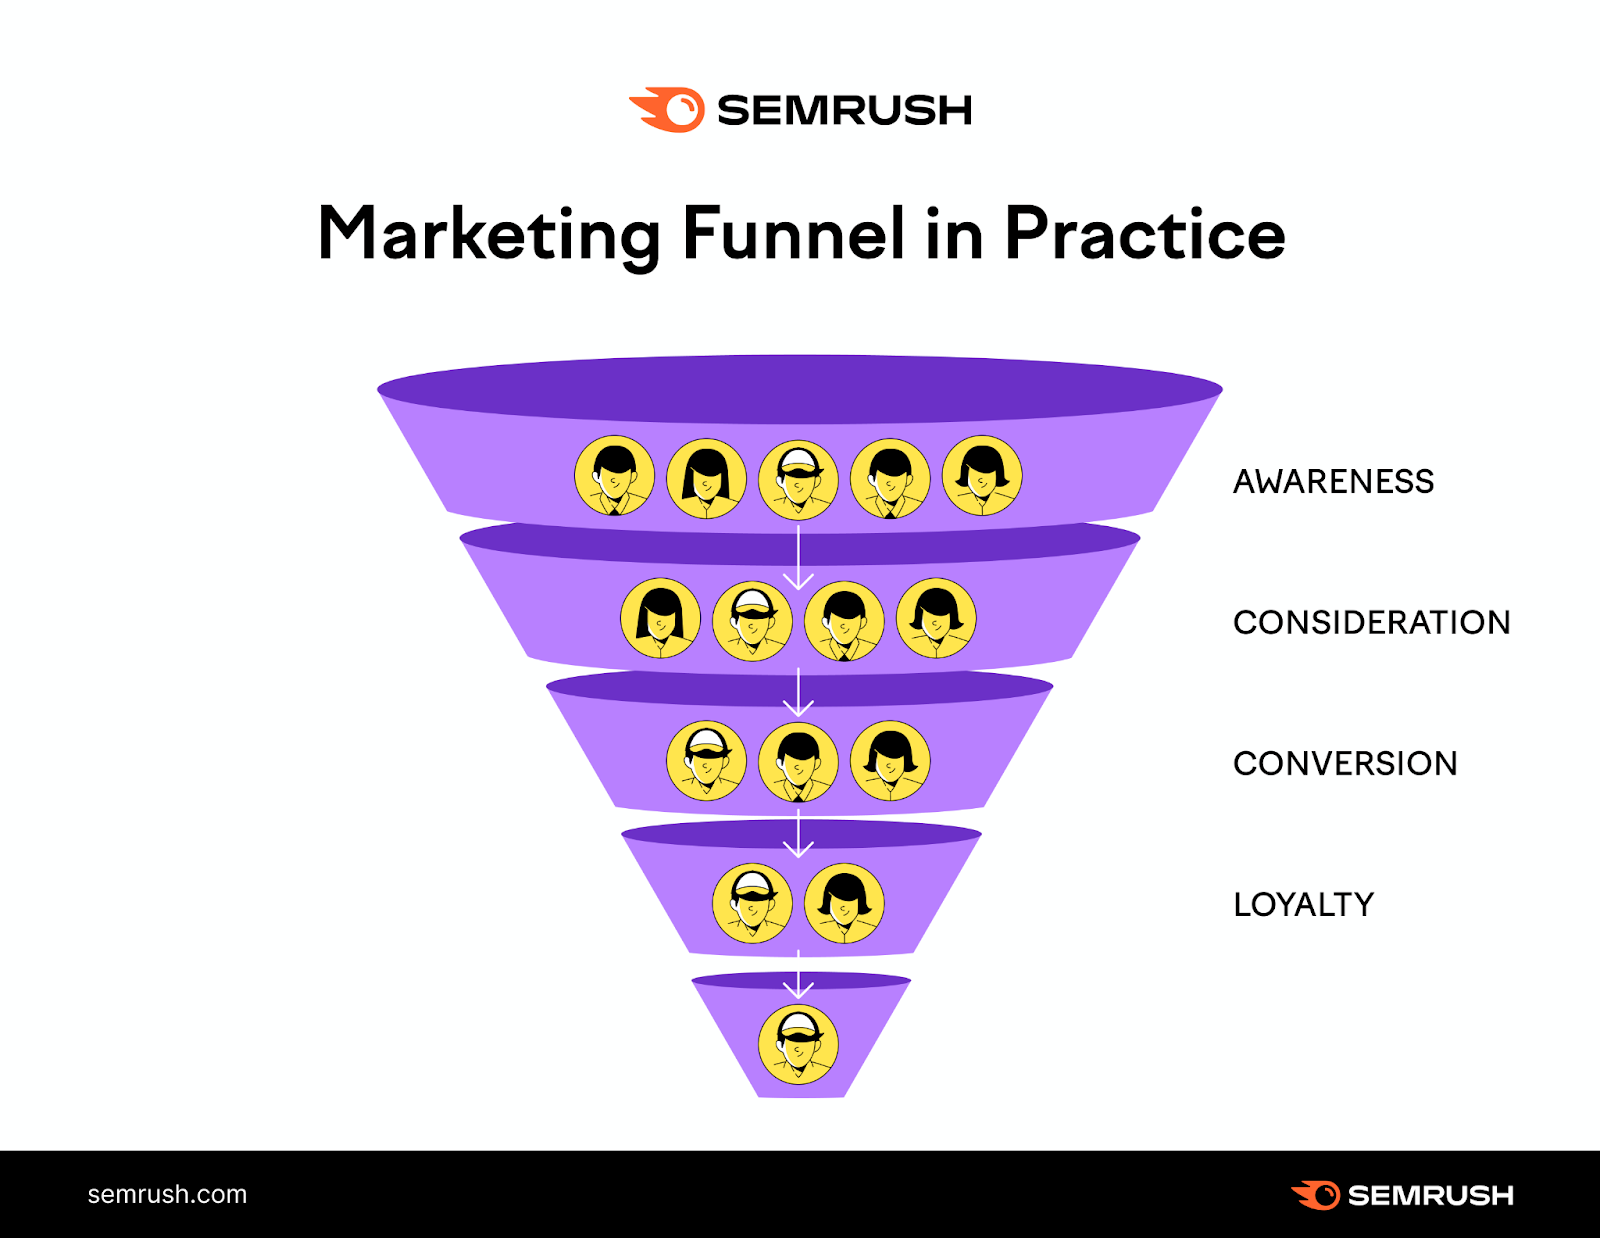
Consumers expect tailored messaging tuned to their needs. These needs differ depending on where they are in your funnel. And what types of people they are.
For example, say a clothing brand learns a segment of their customers is environmentally conscious. So, they decide to create an email sequence that highlights how their brand is eco-friendly. To help this segment in the “consideration” stage.
These tailored touchpoints can turn more people into loyal customers.
Increase Brand Loyalty
Many consumers say they’re more likely to buy from a brand that shares their values. And psychographic research helps you uncover those values.
Then, you can build those same values into your business.
Say you learn that your audience values a good work-life balance. You could highlight how your company empowers team members to take time off and focus on hobbies outside of work.
Customers will be more likely to turn to repeat buyers when they see their values reflect back to them.
Develop Innovative Features and Products
By developing psychographic segments, you can spot opportunities for new offers that grow your business.
A grocery store might learn that a segment of their customers likes to cook. But they also work long hours and don't have time to prepare food. So, the store could create a selection of prepared meals that only require cooking. But no preparation.
It’s easier to develop products your consumers will enjoy when you understand them.
Limitations of Psychographic Segmentation
Here are some things to take into consideration before investing into psychographic market research.
Costly
Psychographic research can be costly to run.
A single focus group may cost anywhere from $4,000 to $15,000.
And surveys may range from $0.95 to $5 per completed survey response. Meaning a single survey with 500 responses can cost $475 to $2,500.
You can reduce the cost by leveraging published insights. And using tools that analyze audiences for you.
Room for Error
Psychographic research contains a mix of qualitative data—non-numerical data—and quantitative data—numerical data.
For example, asking someone to describe their morning routine gives you a qualitative response. (“I get up and have coffee. Then, I shower and get ready for work.”)
Asking someone what time they wake up gives you a quantitative response. (6 a.m.)
Quantitative data is easier to sort and analyze. Because it uses concrete numbers. While qualitative data is often up for interpretation. And your team might draw incorrect conclusions. Which can lead to a strategy that doesn’t align with your audience.
For example, say you’re an outerwear brand. And a survey reveals that your audience likes extreme sports. So, you create a new apparel line that caters to thrill-seekers.
However, your product launch flops. And further research reveals that your audience only likes to watch extreme sports—not participate in them.
To avoid errors, cross-check various data points. And test new ideas on a small scale to validate findings.
Evolving Preferences
Consumer preferences change constantly. And the psychographic segmentation you conduct this year might not be relevant in several years.
But that doesn’t mean you shouldn’t perform psychographic research.
Build systems into your business that constantly collect feedback and data from customers. Like a sales team that adds customer insights into a living document.
Then, compare this data over the years to see how your audience is changing.
Major changes in preferences might indicate that it’s time to redo your psychographic segmentation.
As a bonus, you’ll have a head start on data collection if you’re continuously collecting customer insights.
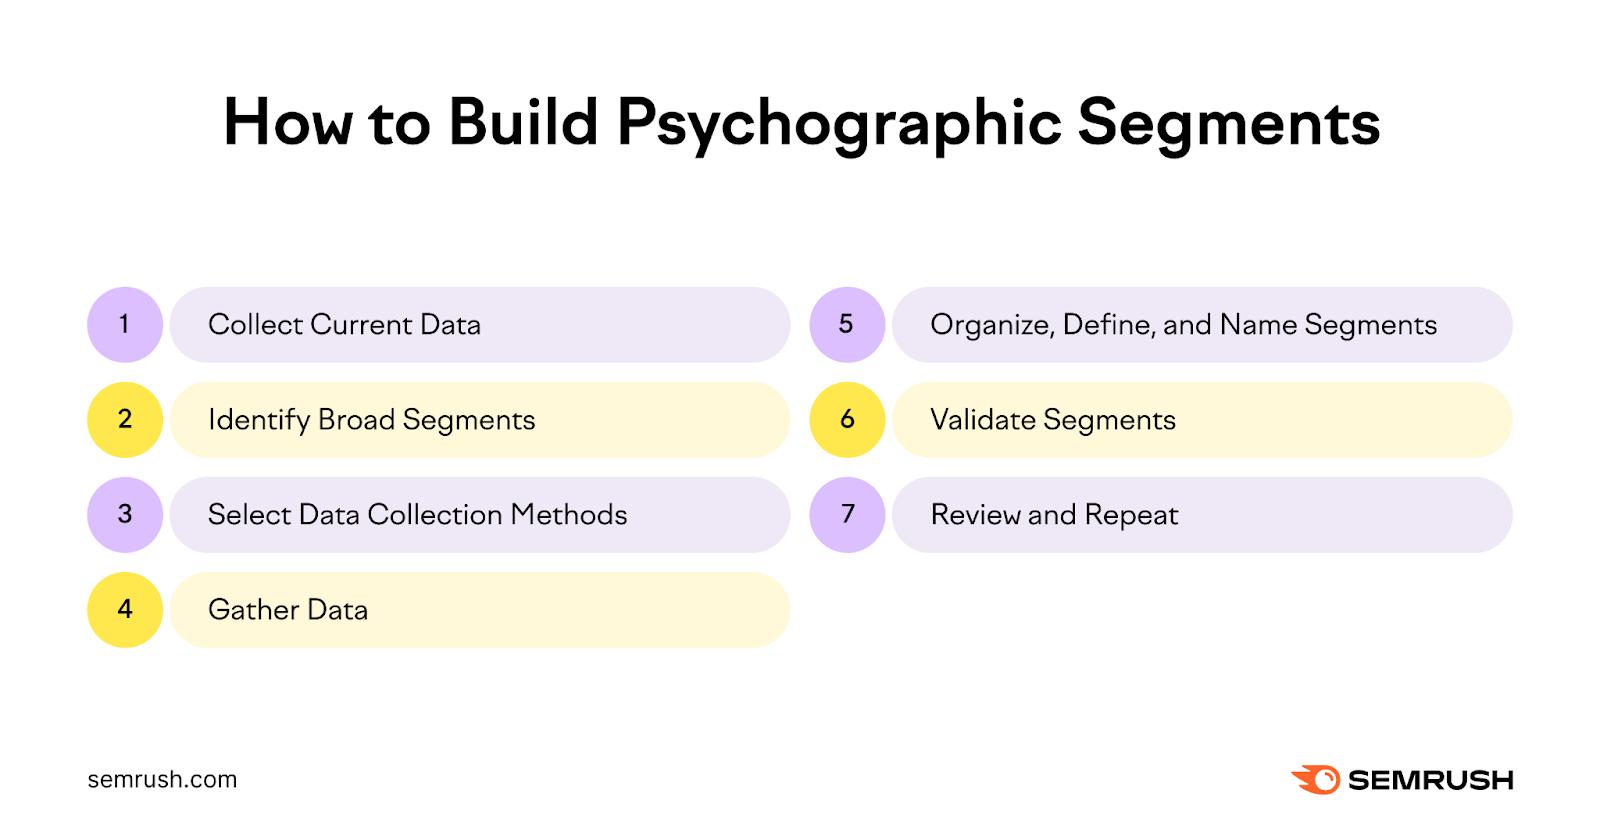
How to Build Psychographic Segments
These steps walk you through the entire process to create valuable psychographic segments.
Collect Current Data
Compile the data you have already so you know where to focus your energy.
For example, if you recently conducted a survey, you might not want to spend time reasking the same questions (assuming the responses were insightful).
Pull audience data from sales teams, past customer interactions (like surveys), and your web analytics software.
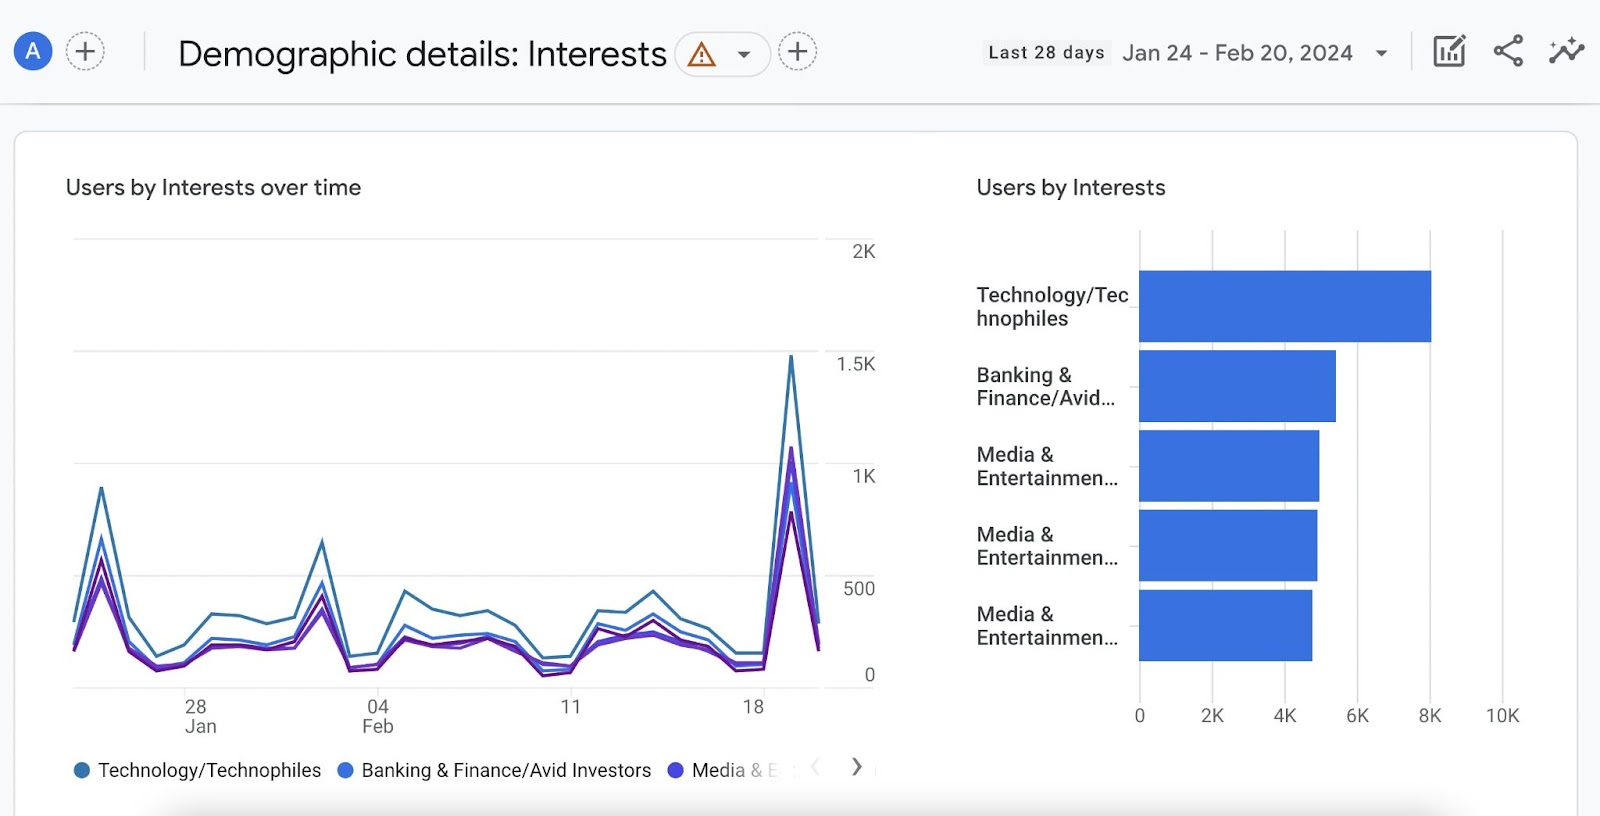
Google Analytics offers basic psychographic information on the people who visit your site. Like their interests.
Identify Broad Segments
Broad segments help you initially define who to research, survey, and speak with.
For example, you might not know the age ranges of your audience. Age isn’t a psychographic factor, it’s a demographic factor. But it helps you nail down the right group of people to research for your psychographic segmentation.
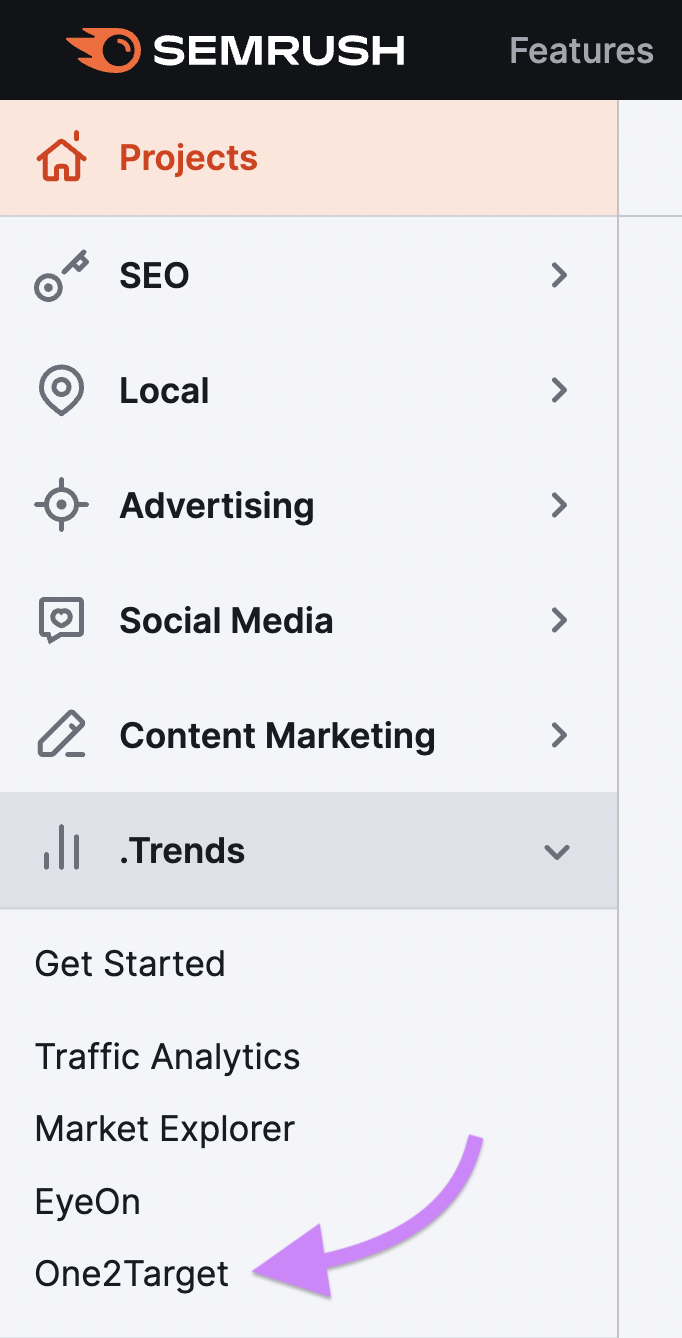
To build out broad segments, use Semrush's One2Target tool. In your Semrush account, click “One2Target” under “.Trends.”
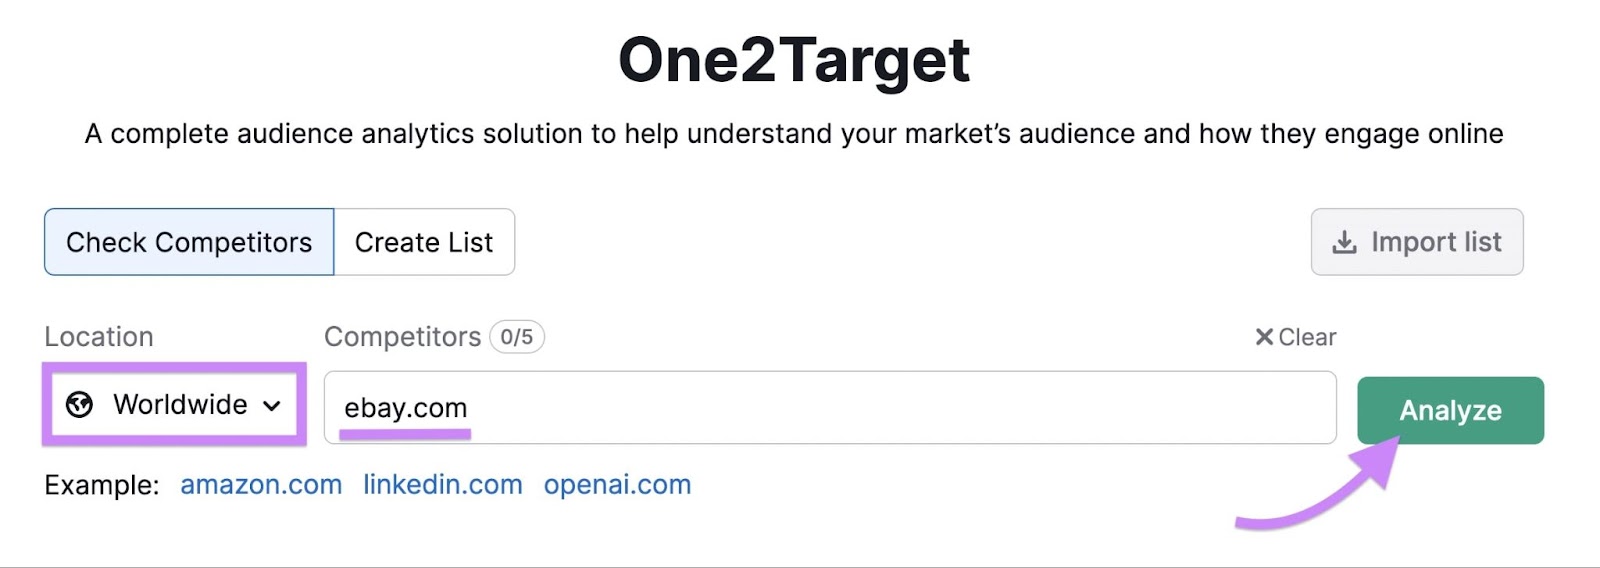
Select your location, enter up to five competing domains, and click “Analyze.”
Click the four tabs along the top to access detailed reports. Like this one for “Demographics.”
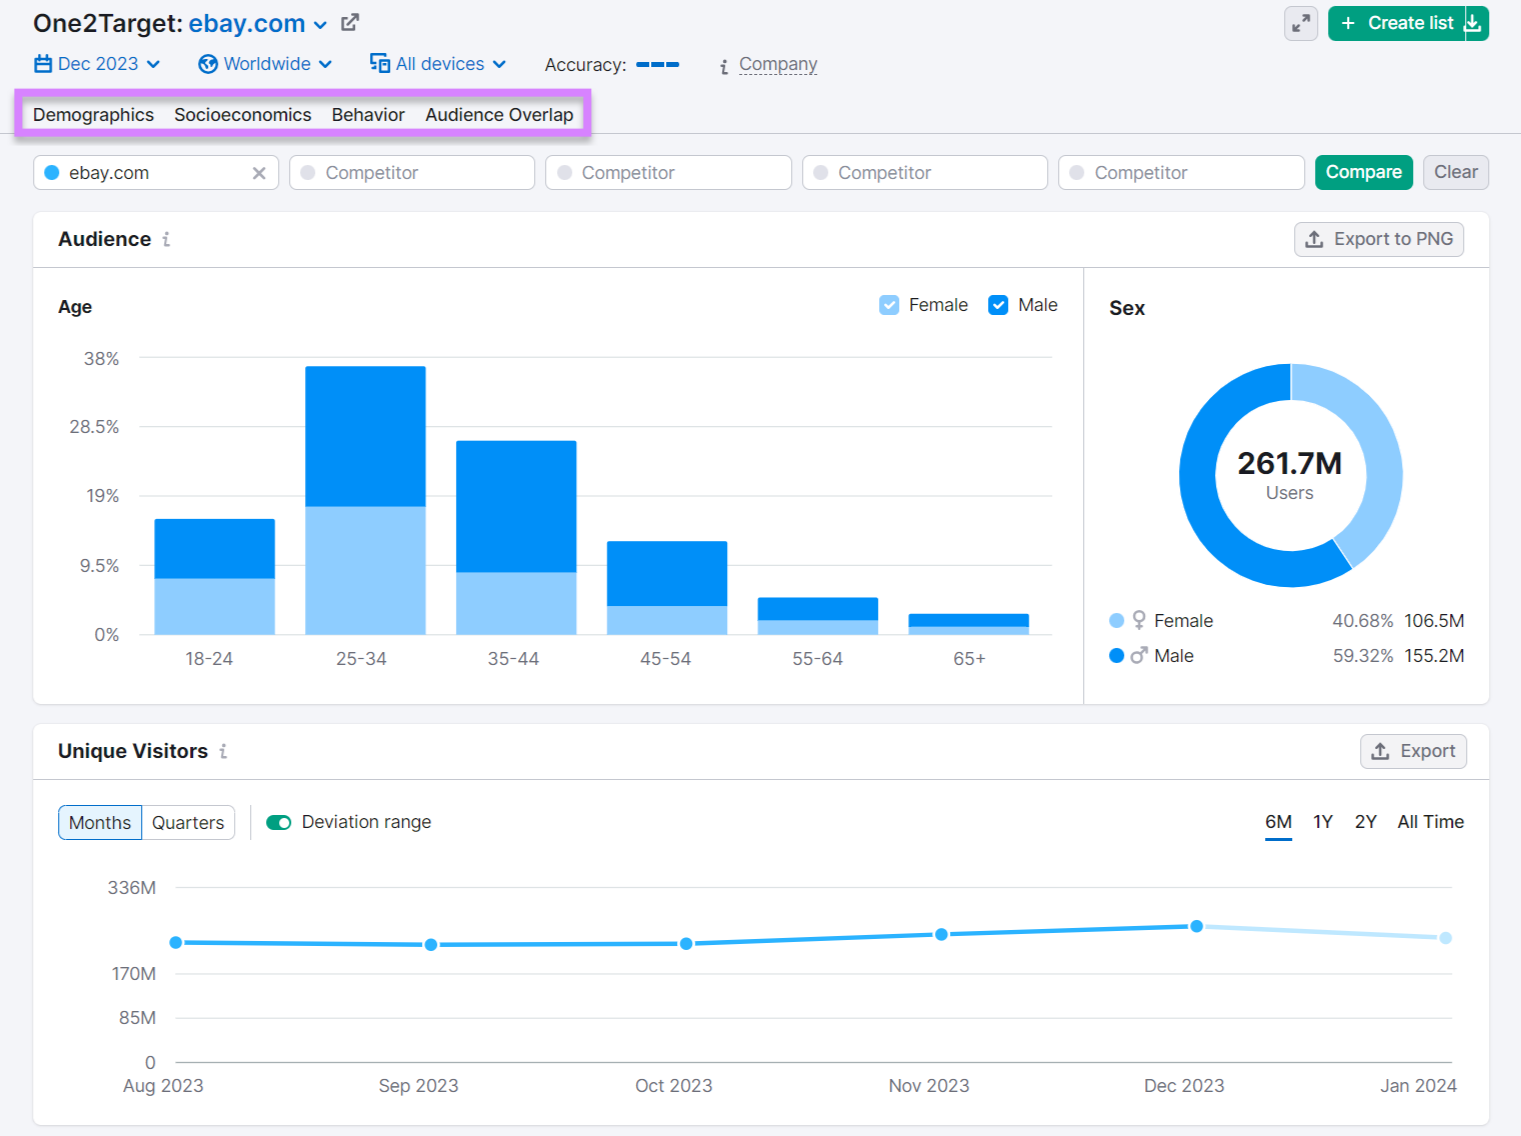
We used eBay for this example. And its demographic report tells us that most of their audience resides in the United States. And is 25 to 34 years of age.
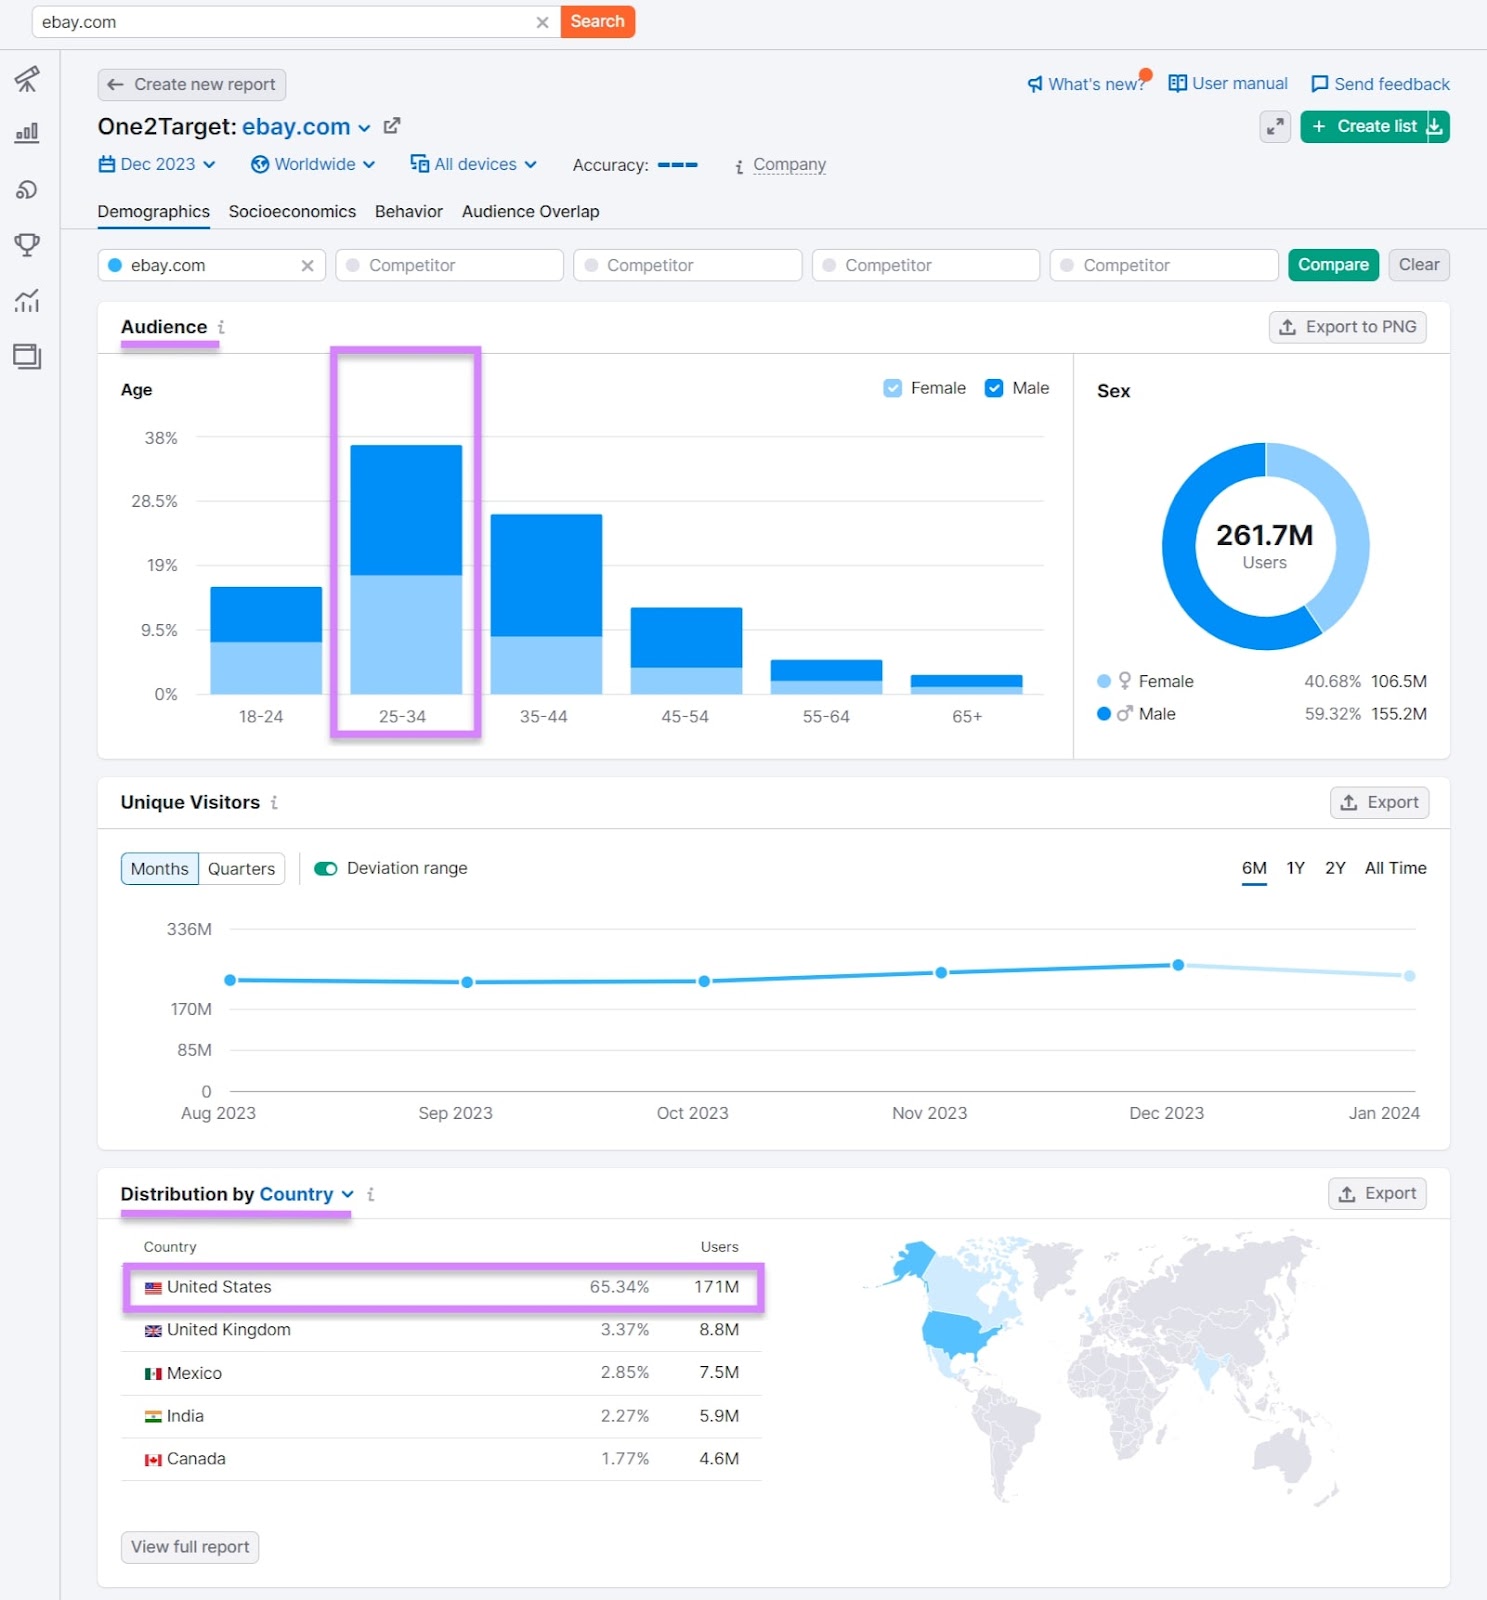
This tells you the age ranges, genders, and residing countries to use for your psychographic segmentation research. For example, eBay likely wouldn’t host a focus group with people over 65 years old. This age group is too small of a segment for them.
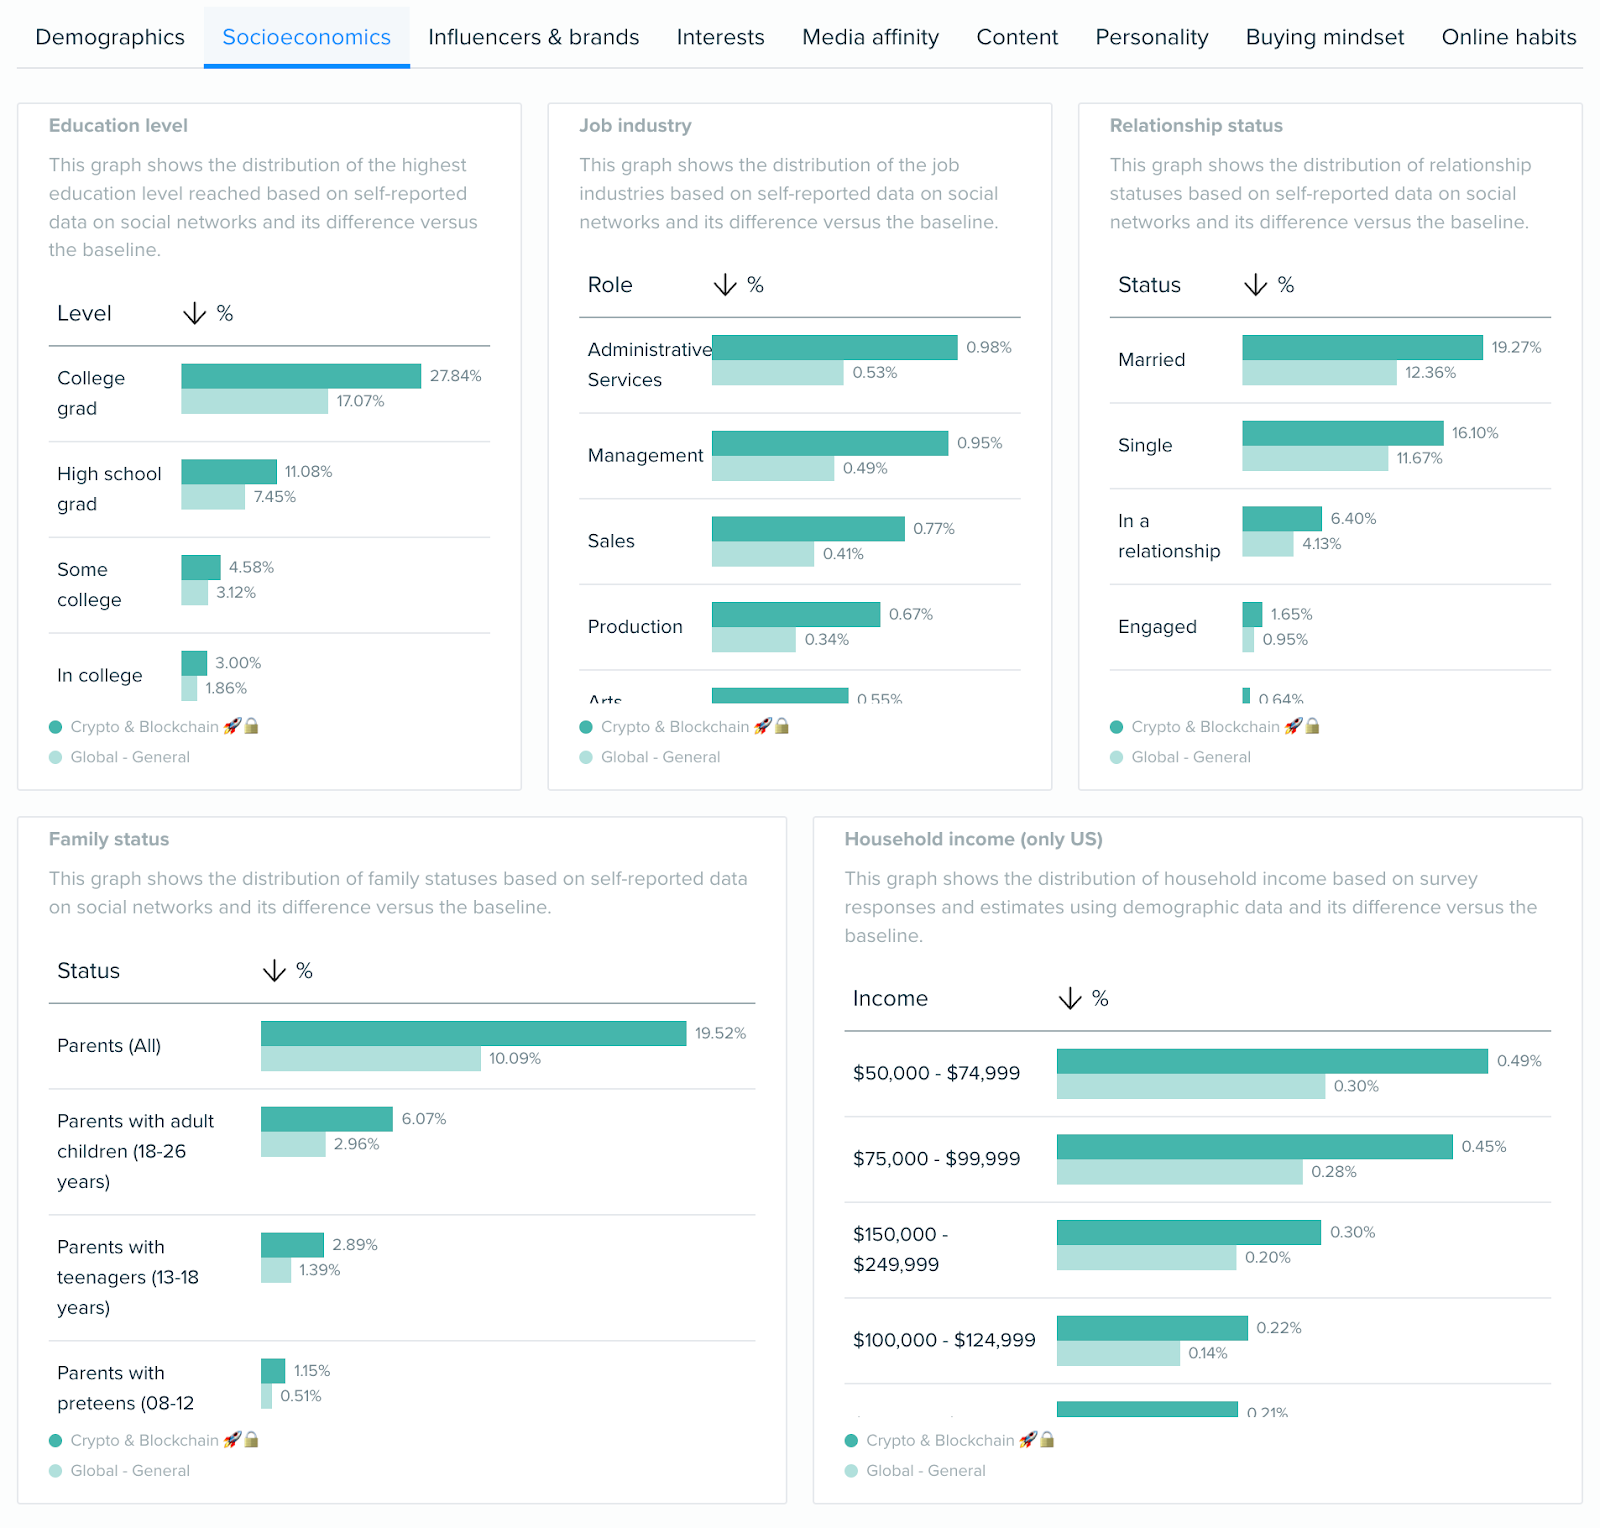
Next, click the “Socioeconomics” tab to discover household size, income level, employment status, and education level.
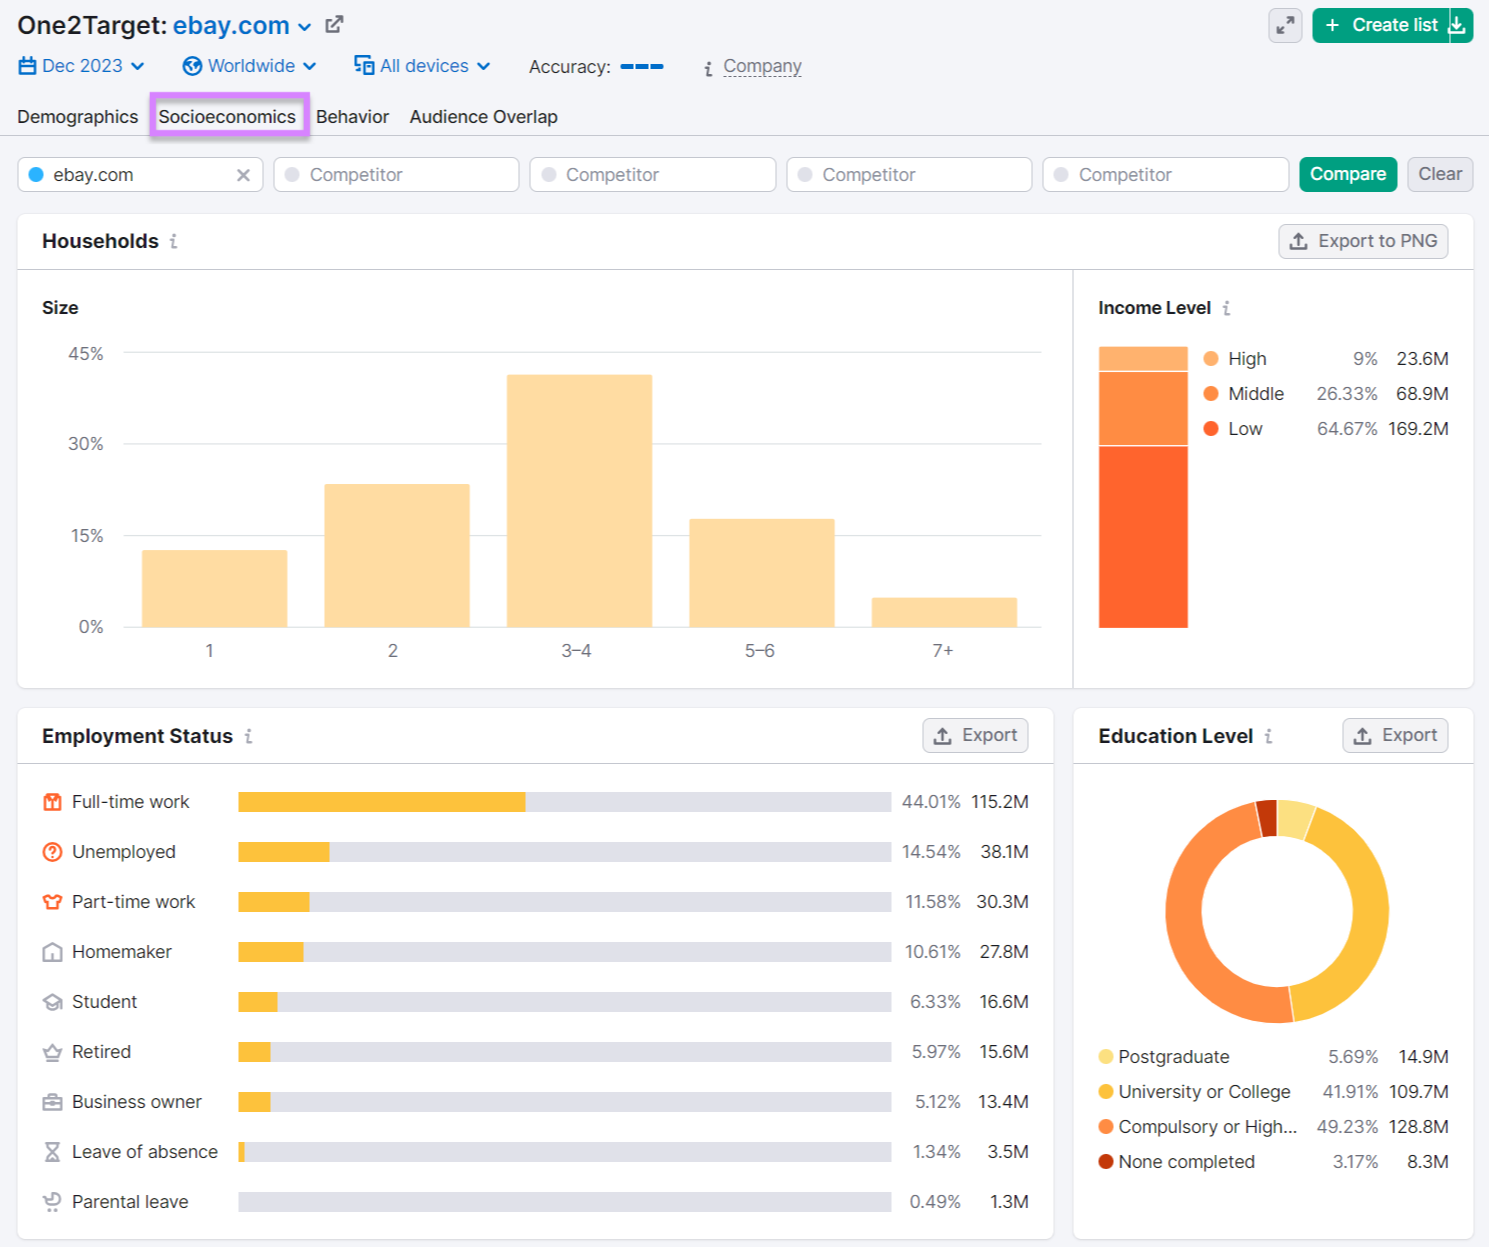
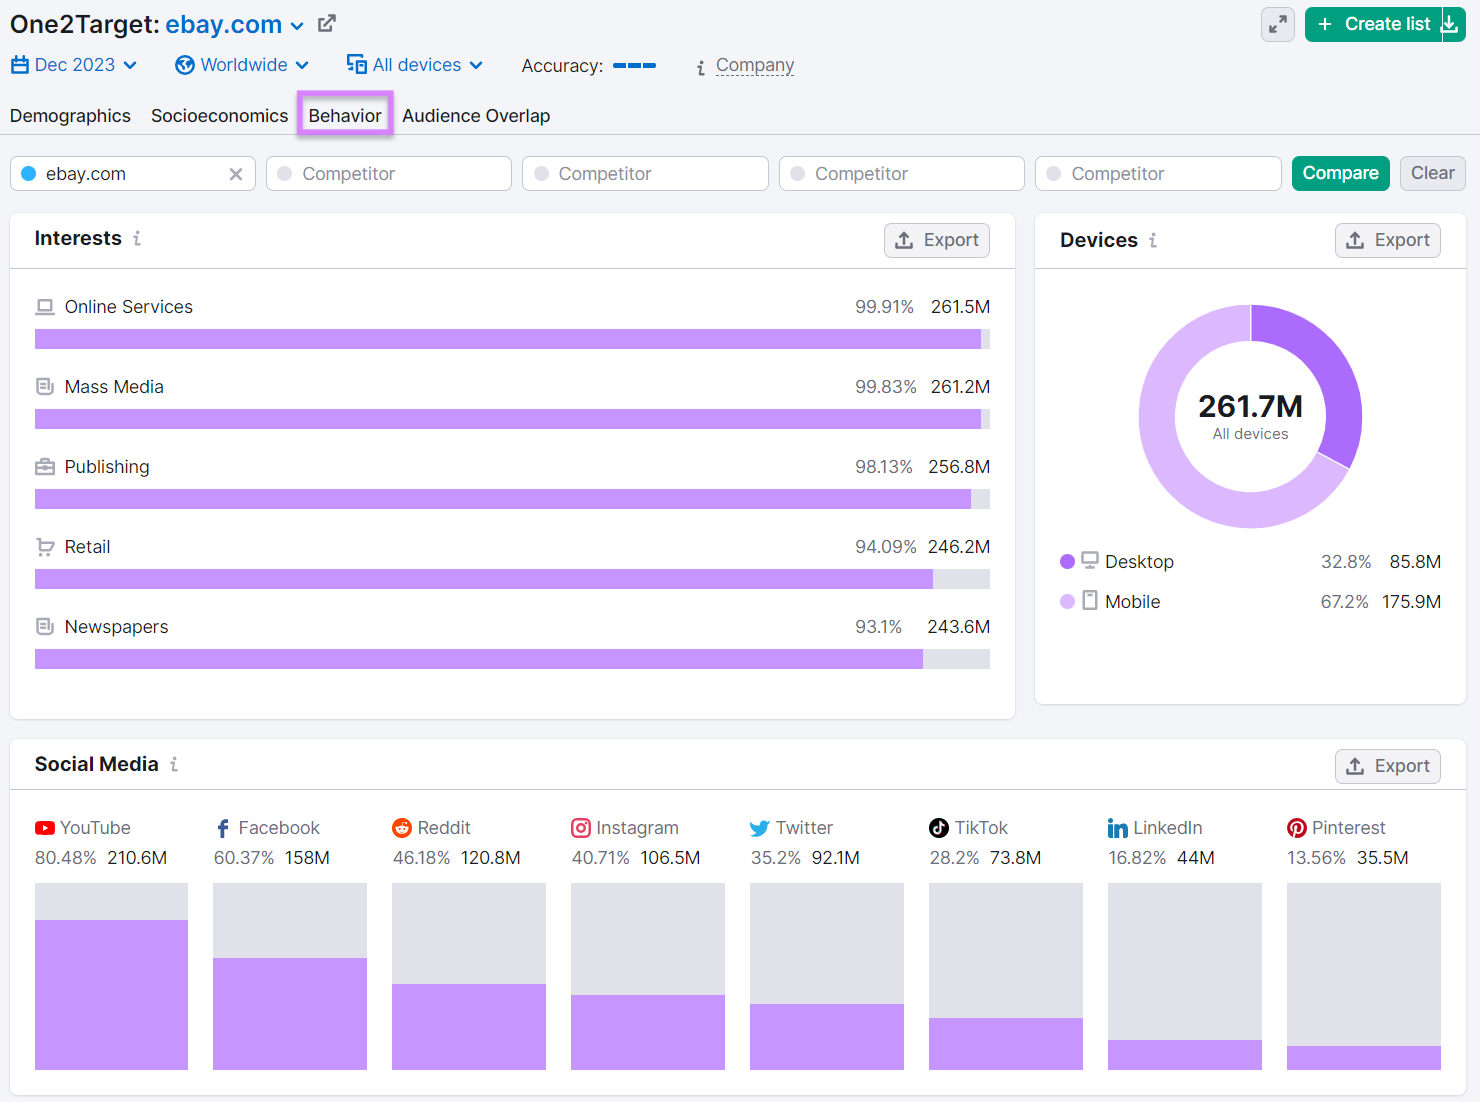
And the “Behavior” tab tells you what this audience likes and which social platforms they use.
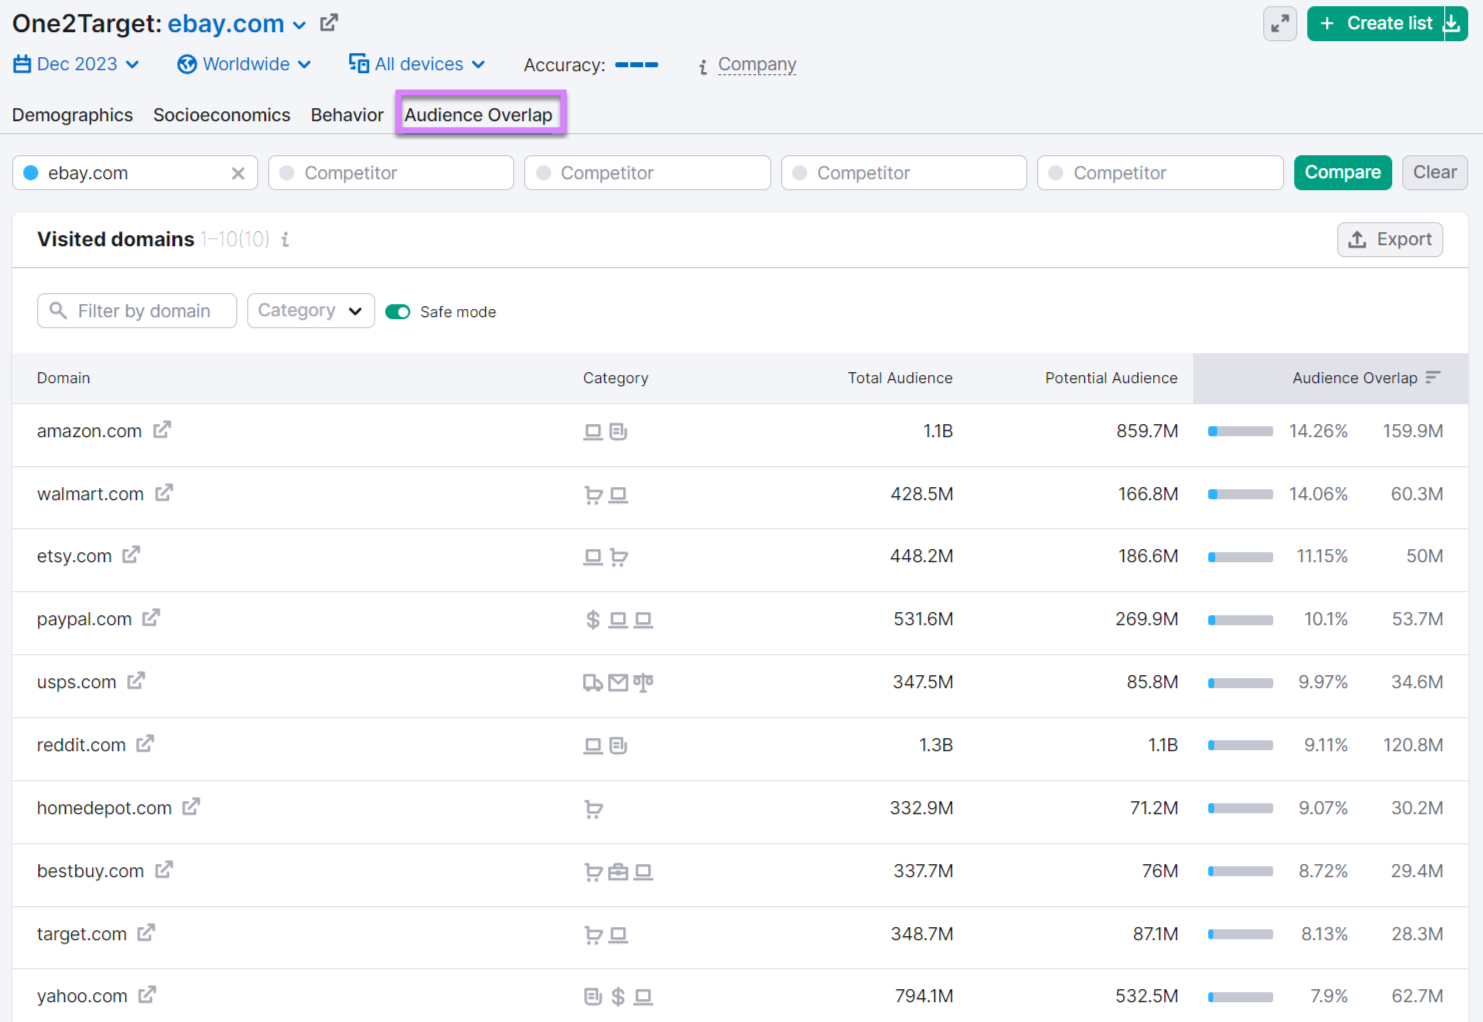
Lastly, the “Audience Overlap” tab tells you which other websites your audience visits. This can help you identify their hobbies, interests, and lifestyles. Which are psychographic variables we’ll cover later on.
Select Data Collection Methods
There are several ways to collect psychographic data on your audience:
- Focus groups: Schedule in-person or online focus groups. Tools like User Interviews help you create virtual focus groups.
- Surveys: Use a tool like Hotjar to add surveys to your website. Or SurveyMonkey to send surveys to specific groups of people.
- Brainstorming sessions: Sit with customer-facing team members and brainstorm what you already know about your audience.
- Publicly available research reports: Places like government websites, public libraries, and nonprofits (like Pew Research Center) have free reports you can use to learn more about your segments.
- Web analytics: Tools like Google Analytics may provide basic psychographic information.
- Market research tools: Use One2Target to gather immediate and actionable data. Or, get in-depth insights with the Audience Intelligence app.
- Customer interviews: Interview customers one on one to gather in-depth information.
- Social media: Spend time where your audience hangs out online. See how they interact with one another, what they say, and how they describe their pain points.
Unsure which research methods are best for you?
Answer these two questions:
- What level of depth do we need? You may need deeper insight if you don’t have previous information on your audience. For example, focus groups can yield deep exploration into your audience. But they’re more expensive. Surveys can get you a large amount of data, but the data tends to be broad.
- What’s our budget? Larger budgets can accommodate activities like focus groups. Whereas teams with smaller budgets may want to opt for other methods of data collection (like market research tools or surveys).
If possible, combine multiple methods. To get a range of data and insight.
Gather Data
The time it takes to gather data depends on your data collection methods. Methods like customer interviews and focus groups can be more time-consuming than a survey blast.
However, as a general rule, aim to spend a few weeks on data collection. This ensures you don’t rush the process. And have enough time to gather the information you need for useful psychographic segments.
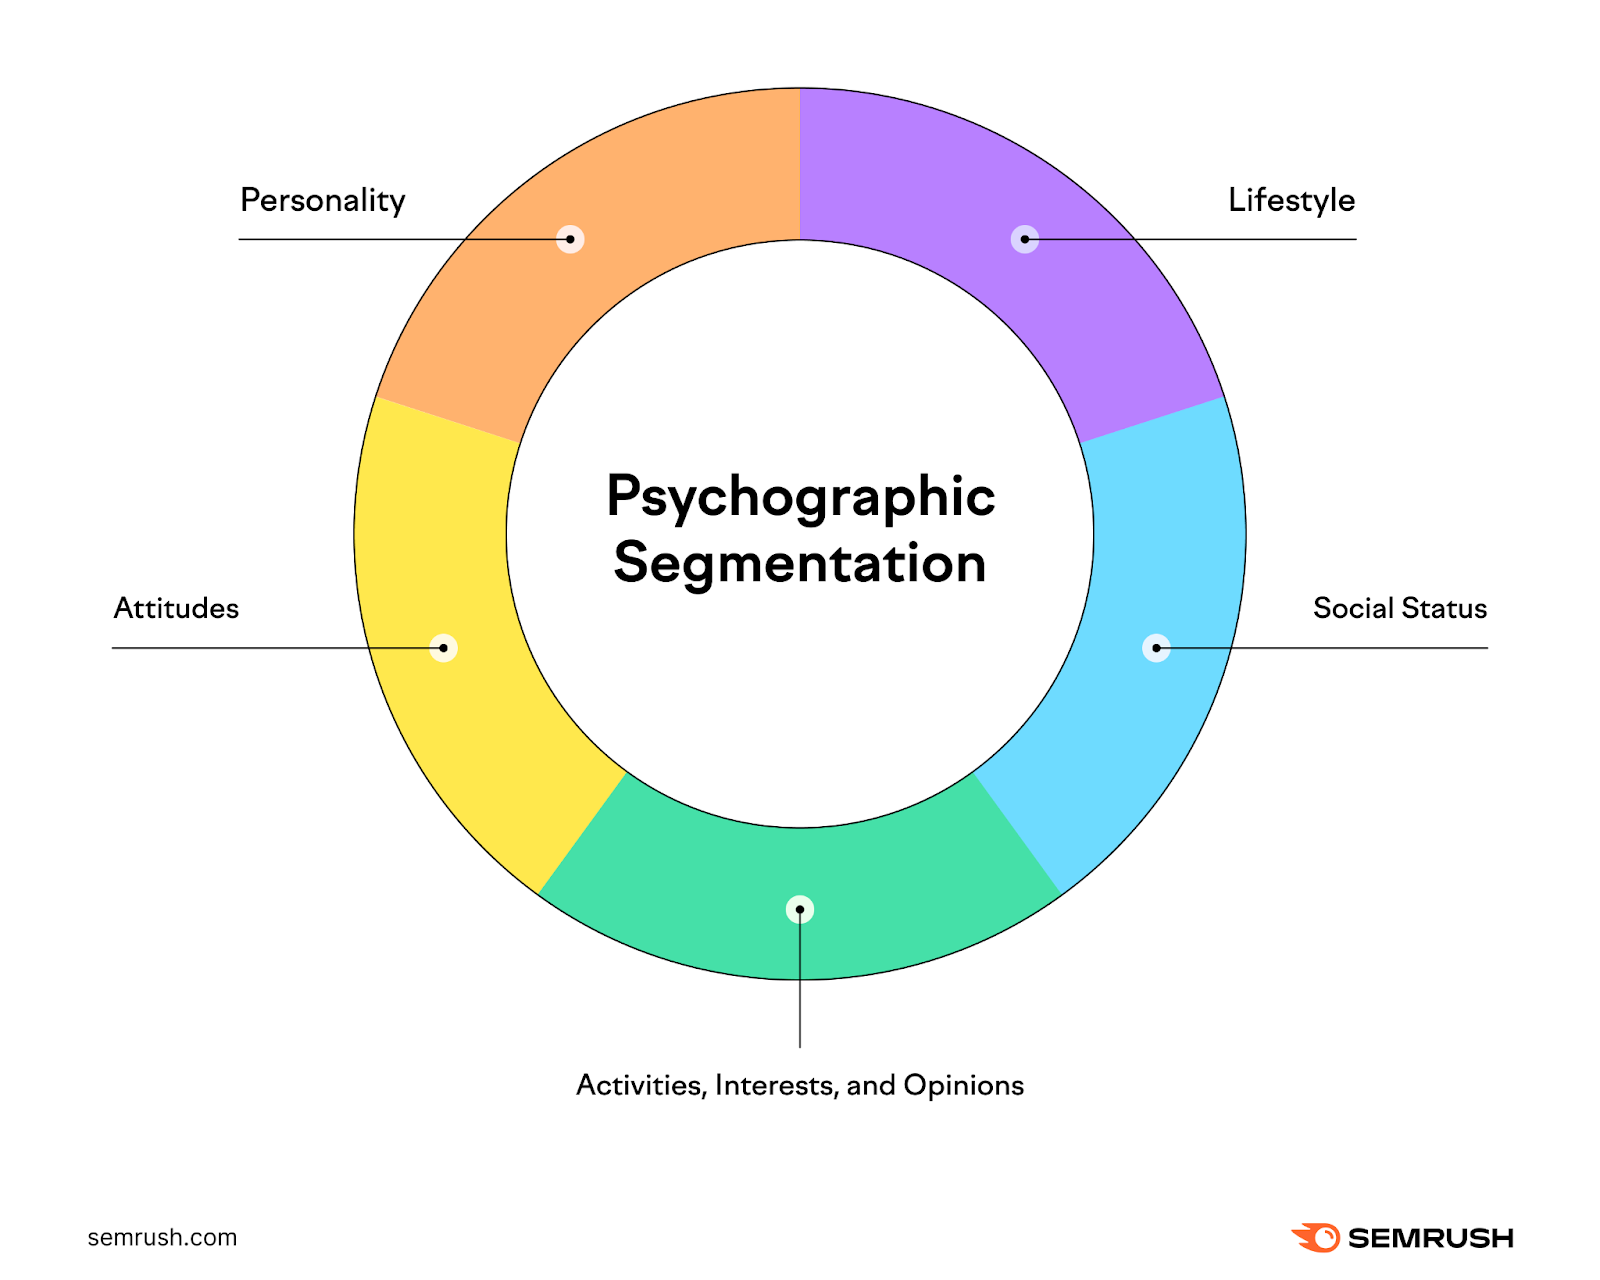
As for which types of data to collect, there are five main variables used in psychographic segmentation:
- Personality
- Lifestyle
- Social status
- Activities, interests, and opinions
- Attitudes

Personality
Personality traits help you understand how your audience moves through the world. And how they interact with people.
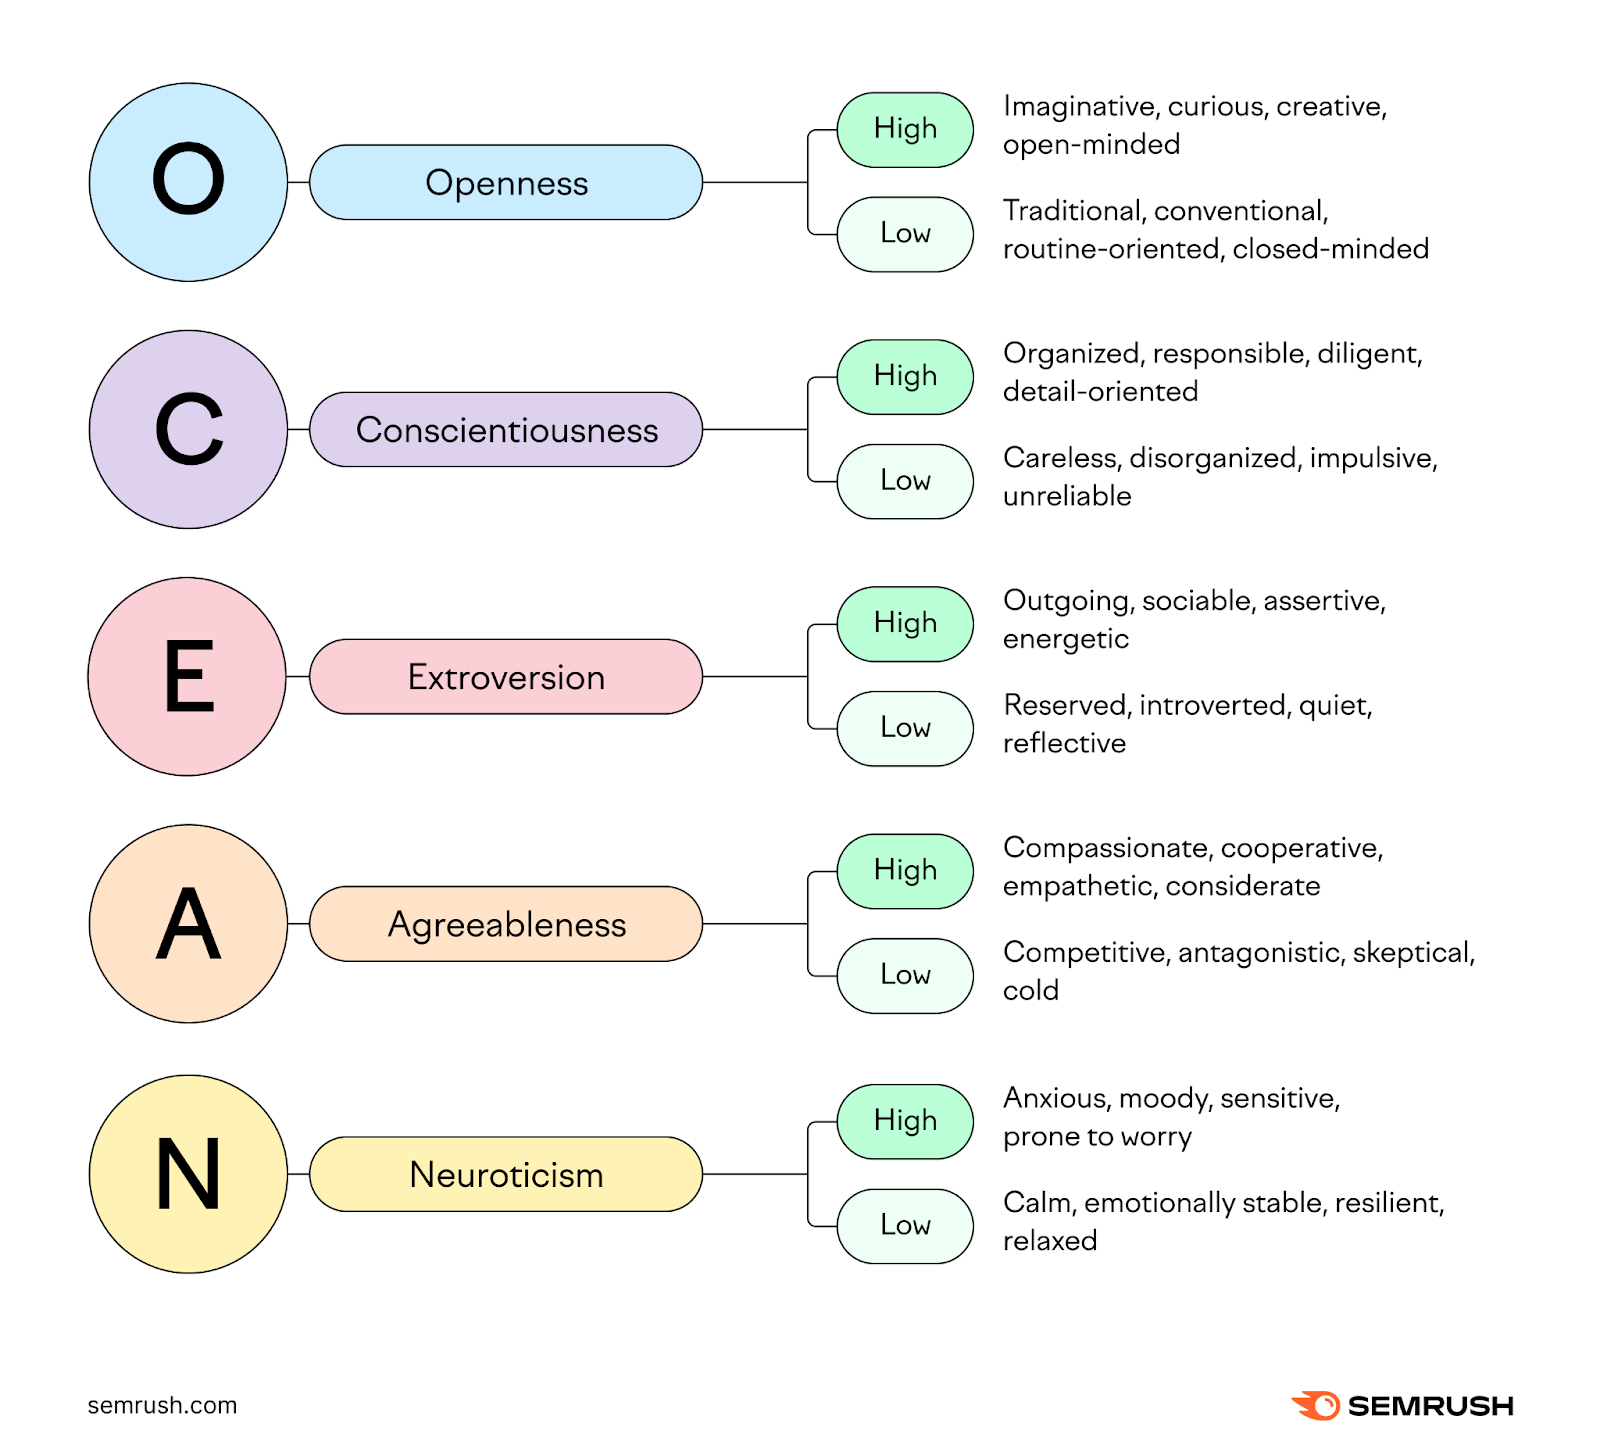
Use the the big five personality traits (OCEAN) to analyze your audience:
- Openness (how open someone is to new experiences): People with a high level of openness tend to be more adventurous and are eager to learn. Whereas someone with a low level might struggle with new experiences.
- Conscientiousness (how responsible and organized someone is): Conscientious people plan ahead and think about how their actions affect others. Someone who isn’t conscientious doesn’t like schedules and rigidity.
- Extroversion (how social and assertive someone is): Someone with high levels of extroversion is talkative and likes being the center of attention. On the other hand, someone with a low level of extroversion prefers solitude.
- Agreeableness (how cooperative and trustful someone is): People with a high level of agreeableness often help others. The opposite is those who are manipulative and uncooperative.
- Neuroticism (how emotionally stable someone is): People who are highly neurotic can be moody and anxious. Whereas someone with low levels of neurosis can cope with stress.
For example, if you learn a segment of your audience is not open, you may assume that this cohort needs additional educational resources to move them from skeptics to buyers.
The easiest way to collect OCEAN information is with the Audience Intelligence app.
Simply enter the handle of an X (formerly Twitter) account that has a relevant follower base. (For example, your own handle or the handle of a popular influencer in your niche.)
Then, go to the “Personality” tab to see detailed information for every dimension.
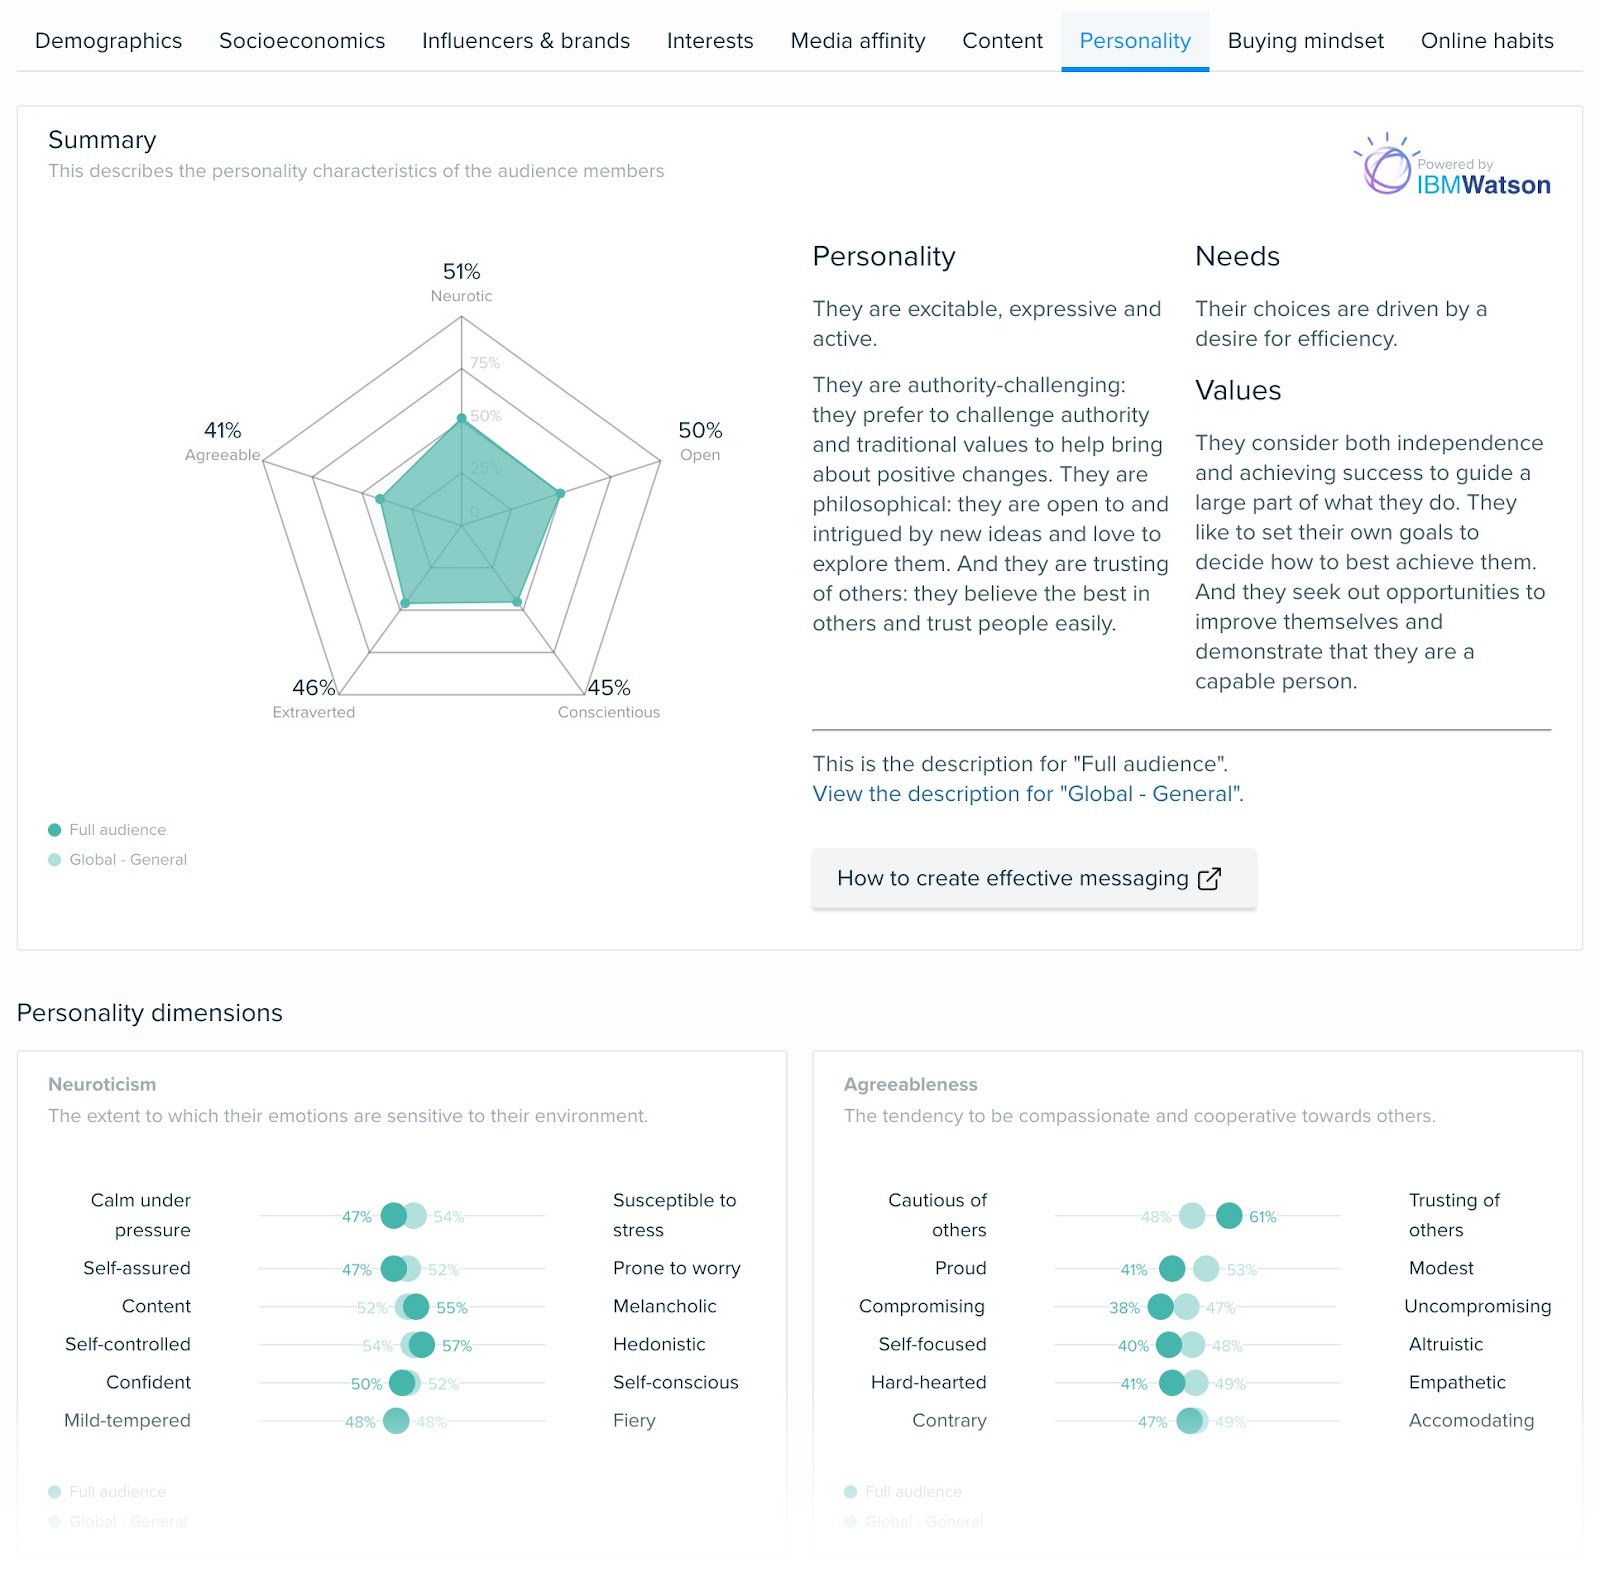
You can even focus on the specific segments the app identifies.
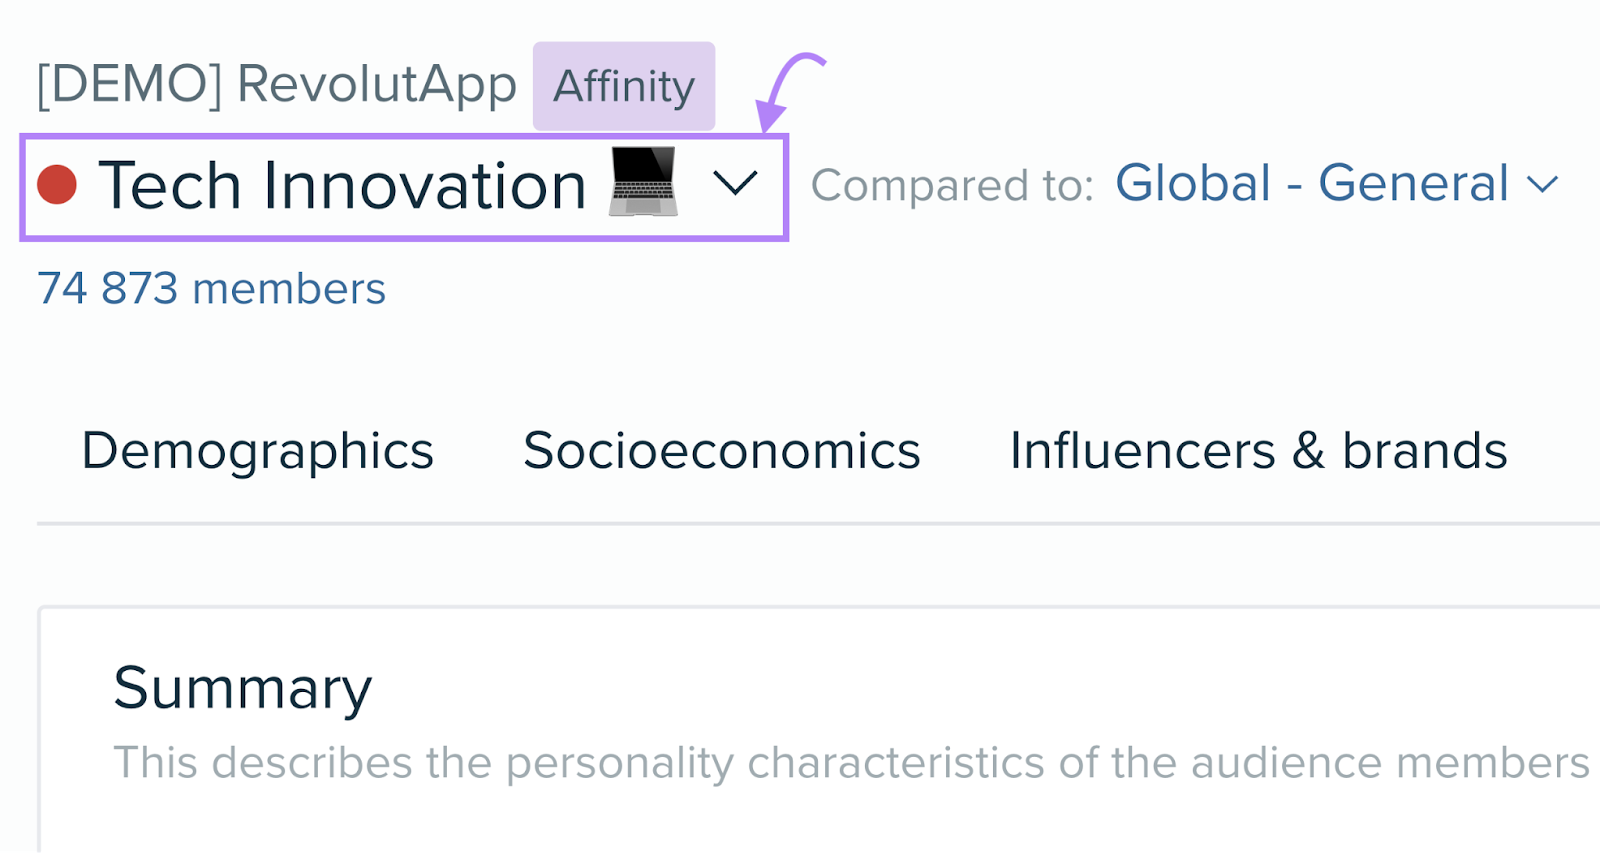
The Audience Intelligence app also provides detailed information about demographics and other psychographic information.
Lifestyle
Lifestyle is how your audience lives their life and spends their money. And it’s influenced by various factors. Including their interests.
An example of a lifestyle is minimalism.
Minimalists prioritize order and intentional living. And may align better with companies who advocate for ethical consumption.
Social Status
Social status is how people believe they fit into a hierarchical society based on things like their income, education level, or job titles.
Knowing how your audience perceives themselves can help you price your products. And tailor your offerings.
For example, someone who believes they have a high social status will likely prefer luxury brands over mass-market brands.
This means they might expect premium service. Which you could work into your products.
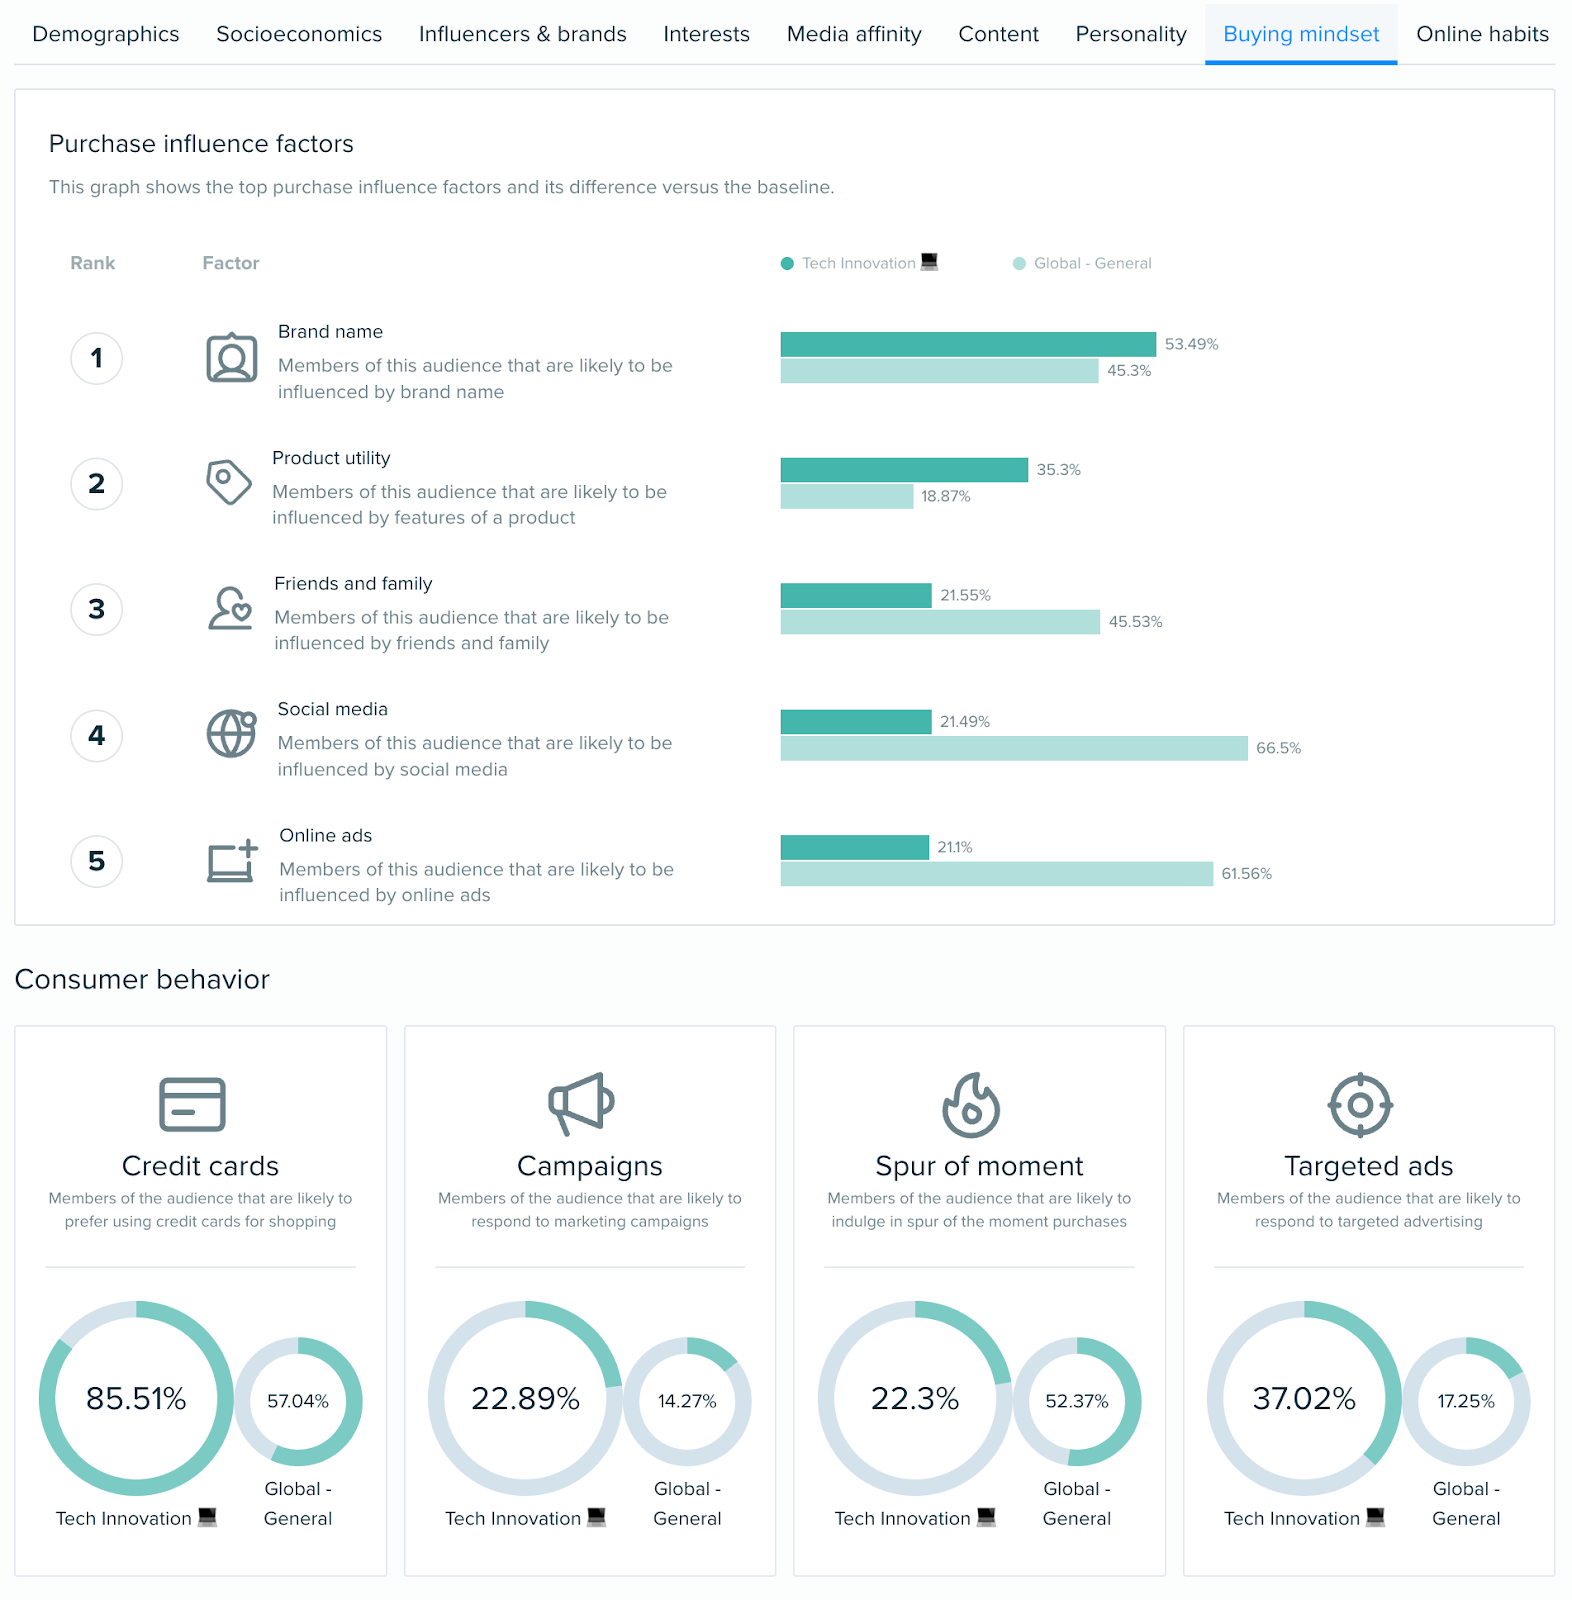
To learn about your audience’s socioeconomic status, use the Audience Intelligence app:
And get valuable insights into their buying mindset (e.g., how likely they are to indulge in spur-of-the-moment purchases).
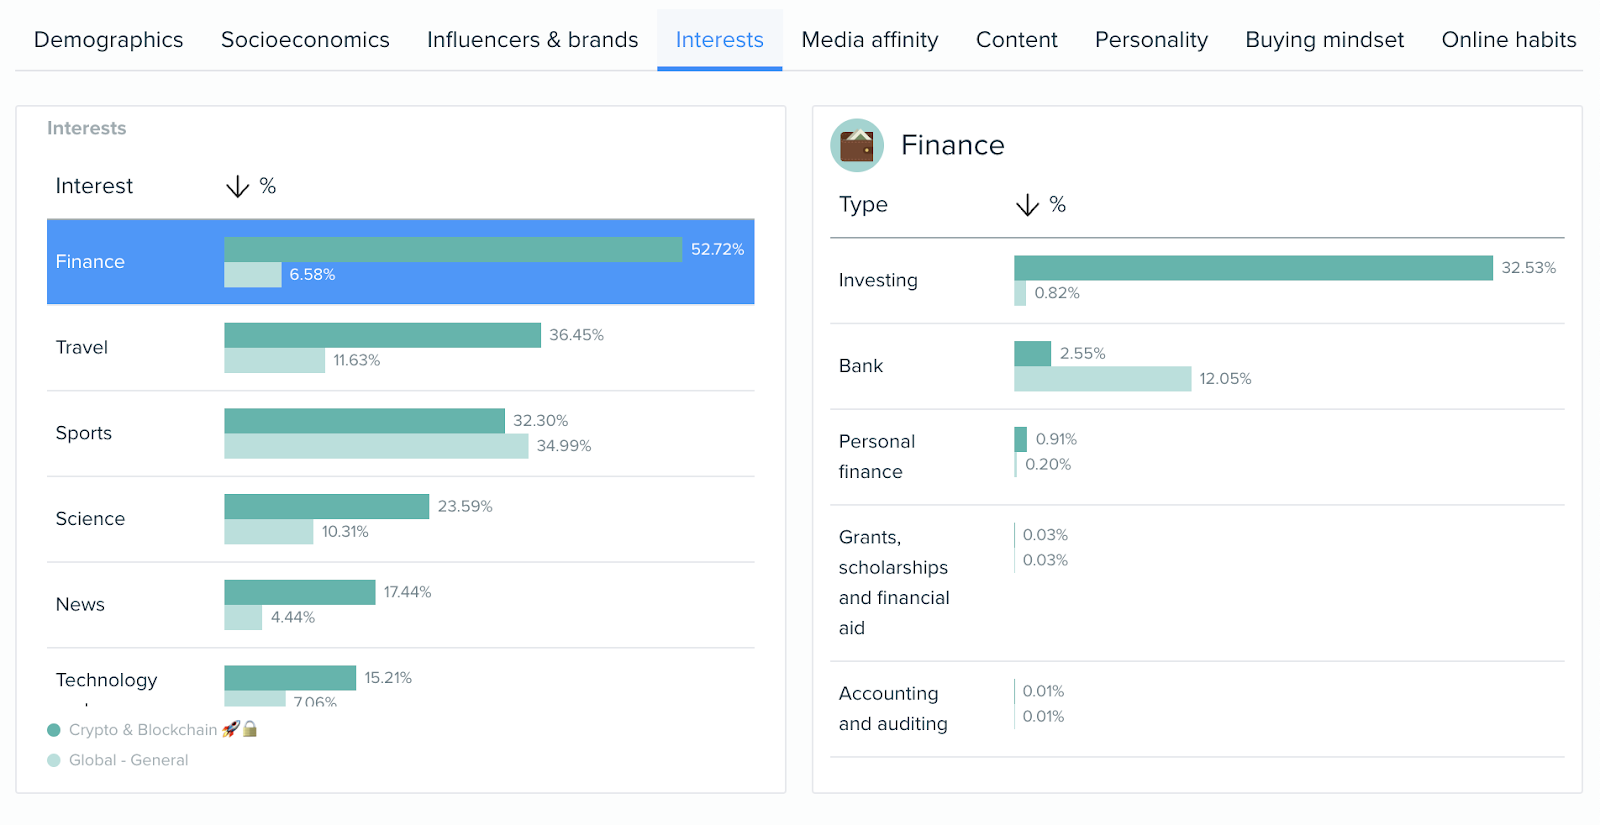
Activities, Interests, and Opinions (AIO)
AIO defines elements your audience cares the most about. Like their hobbies. And what they do in their free time.
Understanding their interests can help you position your products and connect with them on a deeper level.
For example, say you discover that a segment of your audience likes watching horror movies. You might decide to use references from popular horror movies in your marketing. To show you understand them.
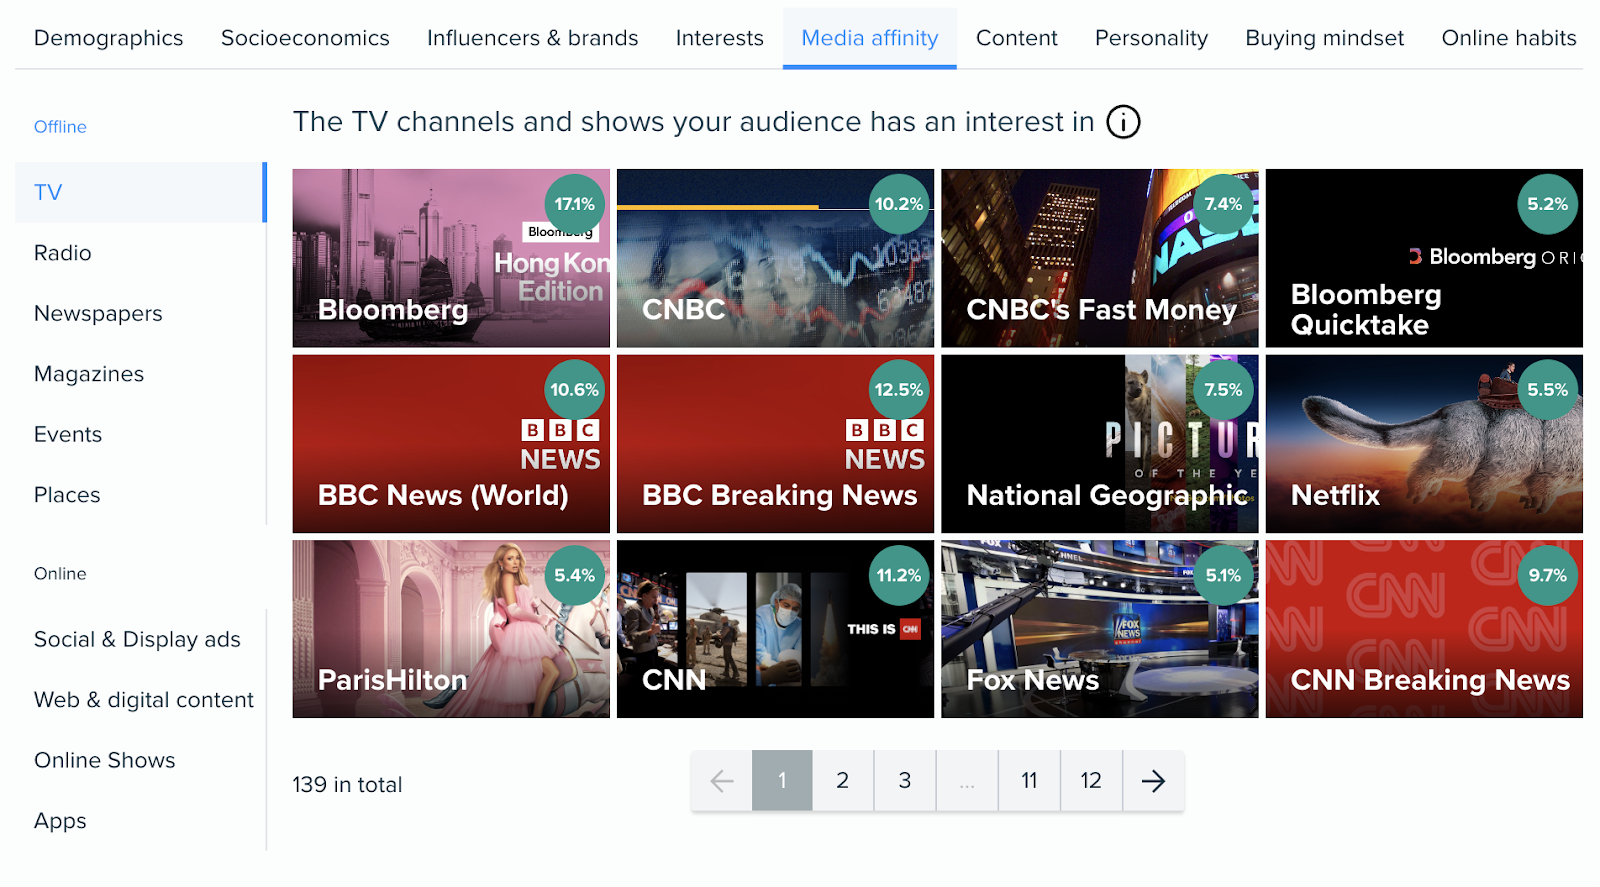
In the Audience Intelligence app, you can identify the most popular interests among your chosen audience or segment.
The “Media affinity” report tells you which TV channels and shows, radio stations and shows, newspapers, magazines, events, etc., the audience or segment is most interested in.
Attitudes
People’s attitudes are usually shaped by their cultural backgrounds and upbringing. And these attitudes influence what people like and dislike. And predict buyer behavior.
Here’s a simplified example: Let’s say you run a bakery. And you uncover a large segment of chocolate lovers.
So, you choose to stock your display cases with mostly chocolate baked goods. To appeal to this segment.
Organize, Define, and Name Segments
After collecting your data, you’re ready to create segments.
Structuring and cleaning your data ensures you can easily segment and analyze it.
Start by compiling your data into a single dataset (like a spreadsheet).
Then, clean it by removing duplicates, errors (such as “null” survey responses), and missing values.
Next, identify psychographic variables within the data that can be used to define segments.
For example, if a significant number of people express an interest in reading in their spare time, consider creating a segment for “readers.”
After your initial segments are identified, dive deeper into each segment to uncover additional defining characteristics shared among members.
This process helps refine segments and provides insights for targeted marketing strategies.
Validate Segments
After creating segments, take a final look over each one.
First, make sure your segments are distinct from one another. Each segment should be unique with minimal overlapping characteristics.
Then, check that each segment is sizable enough to target. This depends on your industry, competitive landscape, goals, and more. If a segment is too small, consider merging it with a similar one. Or removing it altogether.
If segments aren’t sizable or unique, you may want to go back to the previous step and revisit your raw data.
Review and Repeat
Review segments periodically so you know when it’s time to update your psychographic segments.
Because remember: Consumer preferences evolve over time.
A good indicator that it’s time to refresh your segments is when you notice shifts in consumer behavior, new industry trends, or changes in societal values.
Combining Psychographics with Other Segmentation Methods
Pair psychographic segmentation with other types of information for a deeper understanding of your audience.
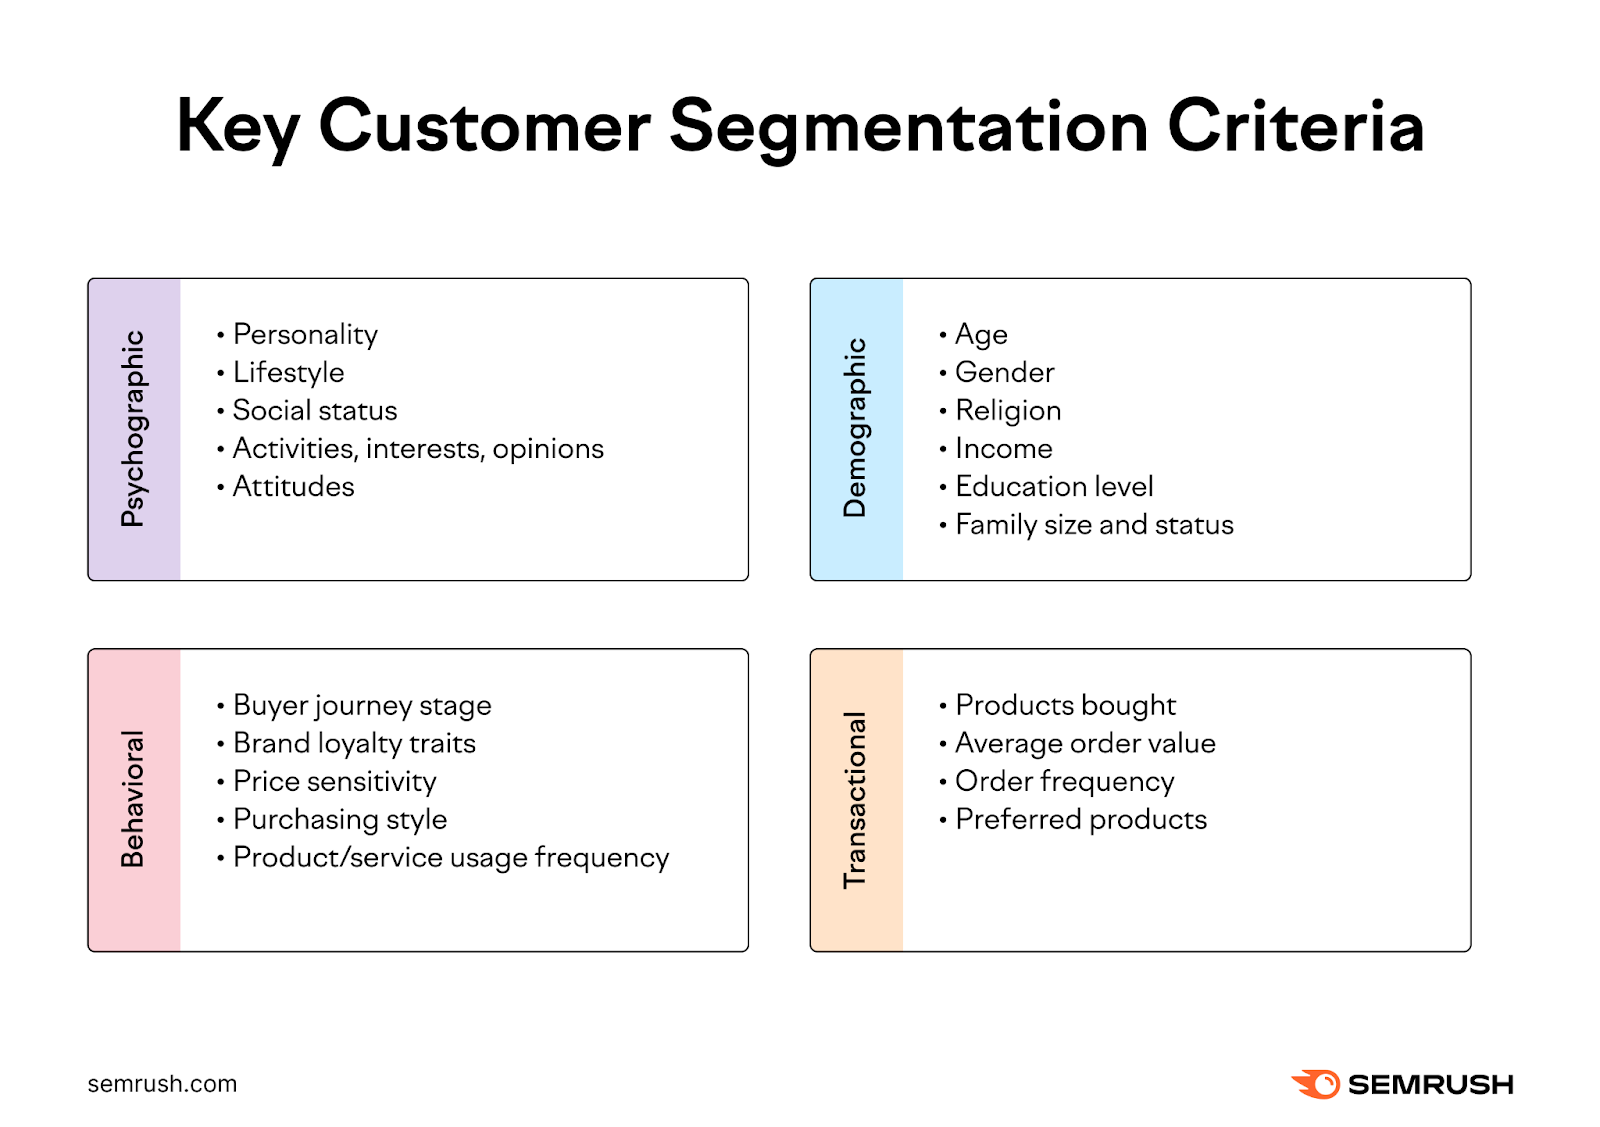
Psychographic vs. Demographic Segmentation
Demographic data is your audience’s age, gender, income, education, and religion. Among other factors.
Pair demographic information and psychographics to identify certain age groups or income brackets that might have unique attitudes.
Psychographic vs. Transactional Segmentation
Transactional data opens your eyes to your audiences’ buying patterns—what they buy, how much they spend, and how much they spend each order.
For example, you might learn that a specific psychographic segment makes monthly purchases for your products. And that a monthly subscription could be something they’d enjoy.
Psychographic vs. Behavioral Segmentation
Behavioral data is how customers interact with your brand throughout the marketing funnel.
This might include information like how often they visit your website, open your emails, or read your blog posts.
Pairing behavioral and psychographic data might show you which types of customers prefer to read blog posts.
Then, you can brainstorm blog post ideas that resonate with this specific segment’s interests and attitudes.
Examples of Companies Using Psychographic Segmentation
We can’t say for sure which companies perform psychographic segmentation. As that research is typically private.
However, the below three brands seemingly have distinct customer segments. These examples can give you an idea of how psychographic segmentation might look in real life.
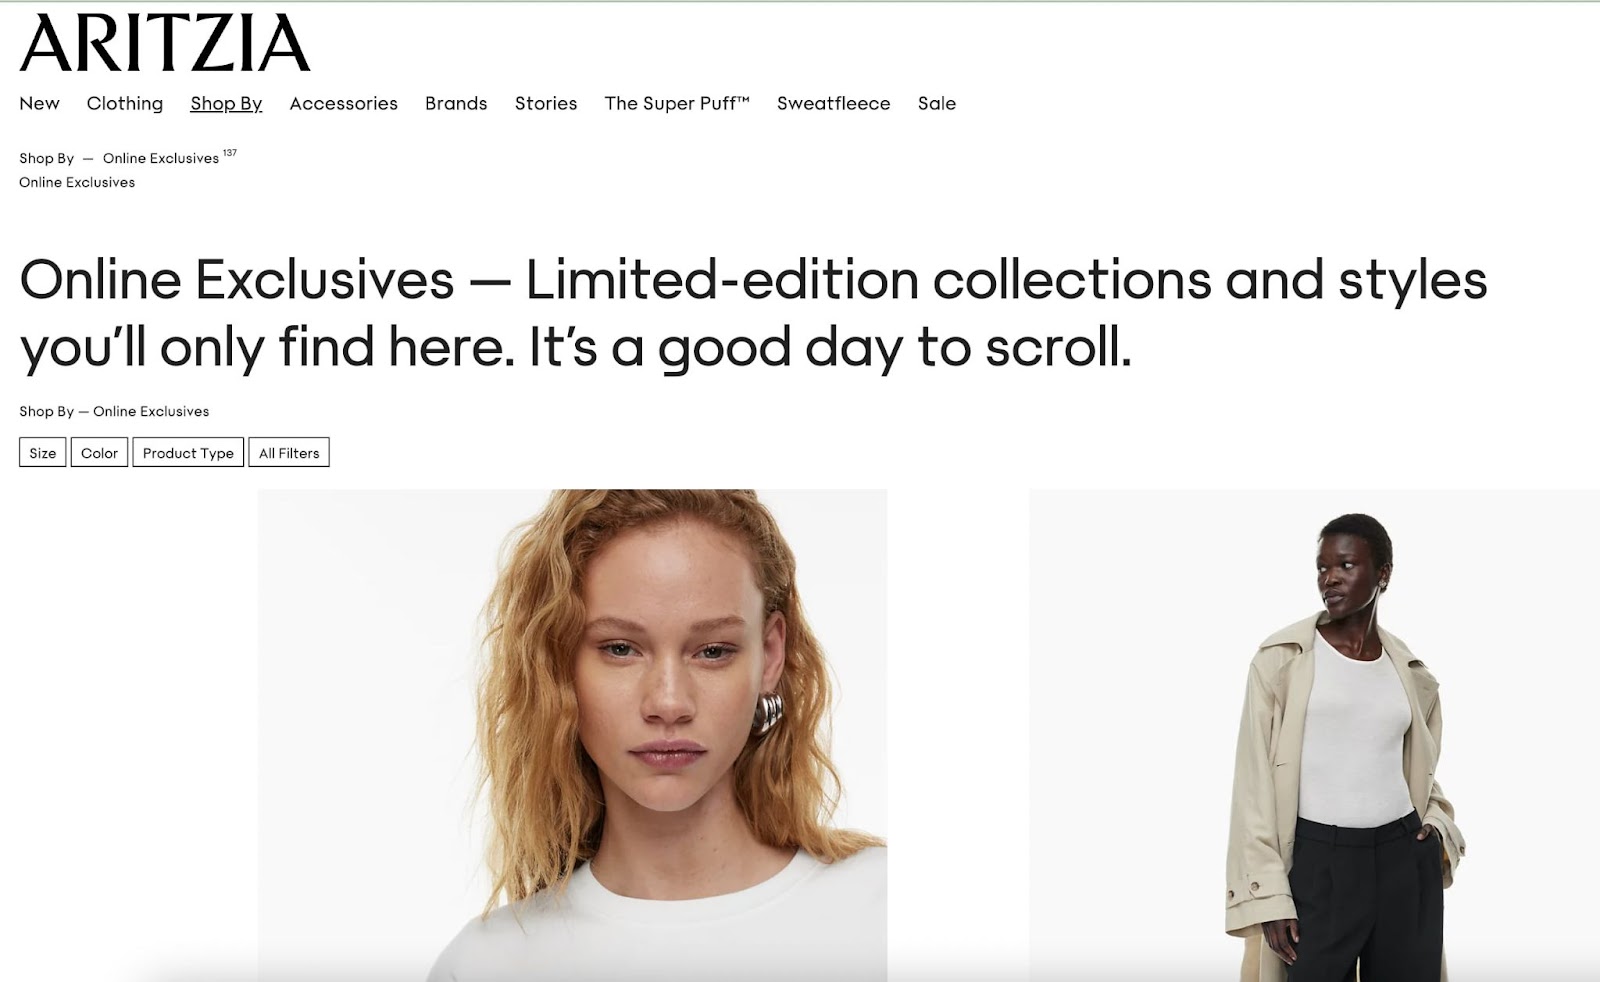
Aritzia
Fashion brand Aritzia’s limited-edition collections showcase how they cater to a segment that likely values exclusivity and fashion.
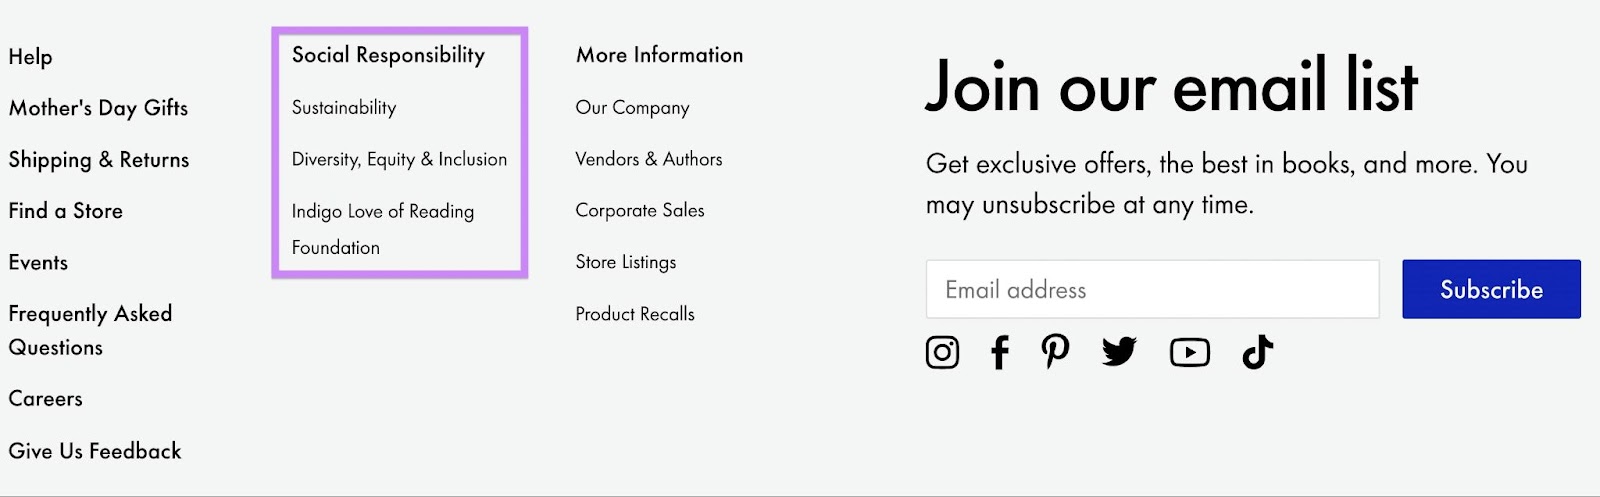
Indigo
Book retailer Indigo likely understands that their audience cares about social issues. So, they feature books on their homepage relevant to diversity:

And have a section dedicated to social responsibility in their site’s footer:
Nike
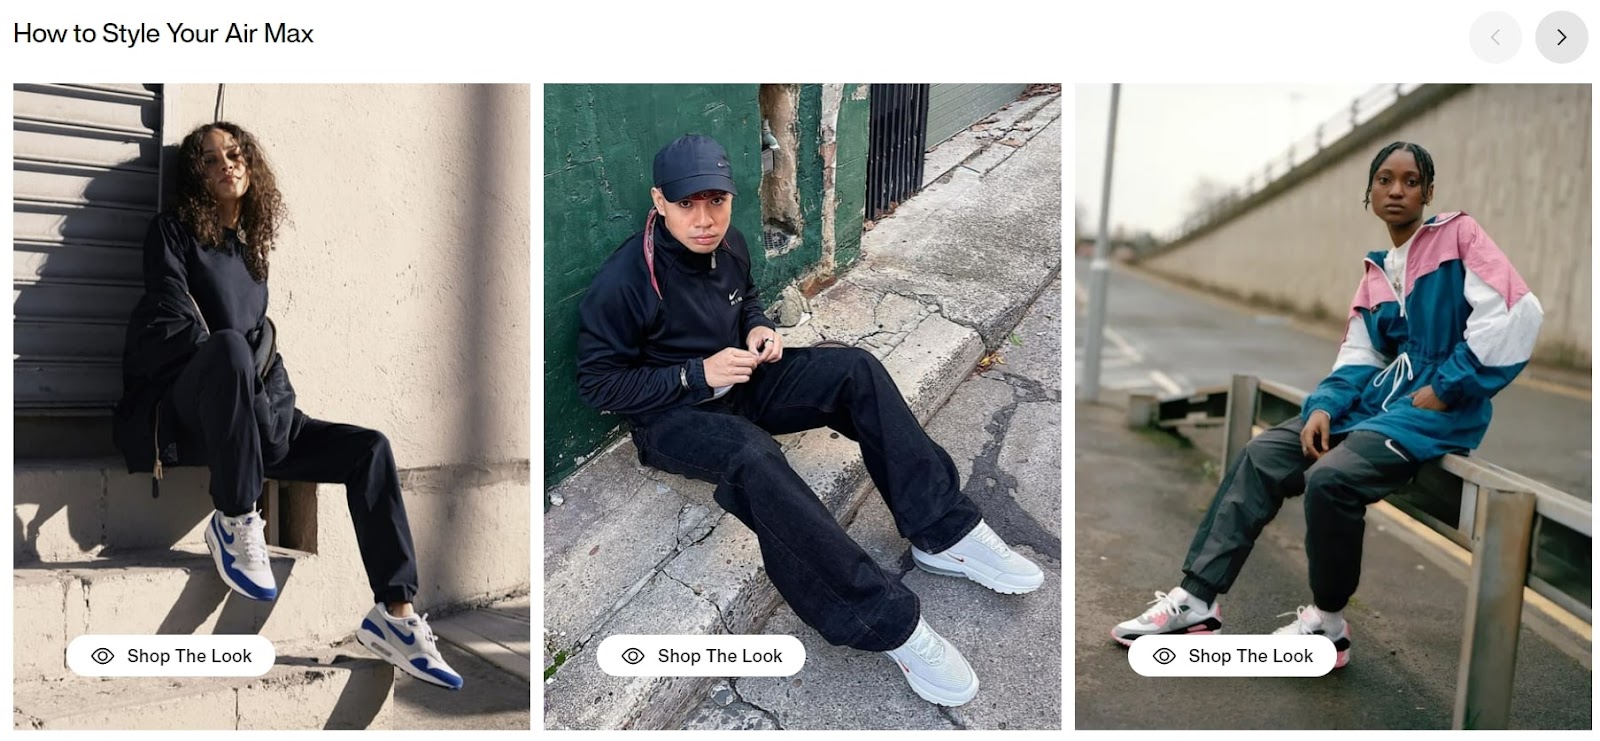
Get a glimpse into Nike’s potential psychographic segments by clicking through their products.
The Air Max page displays stylish photos. Along with links to style the Air Max shoe. Which tells us this buyer may value fashion.
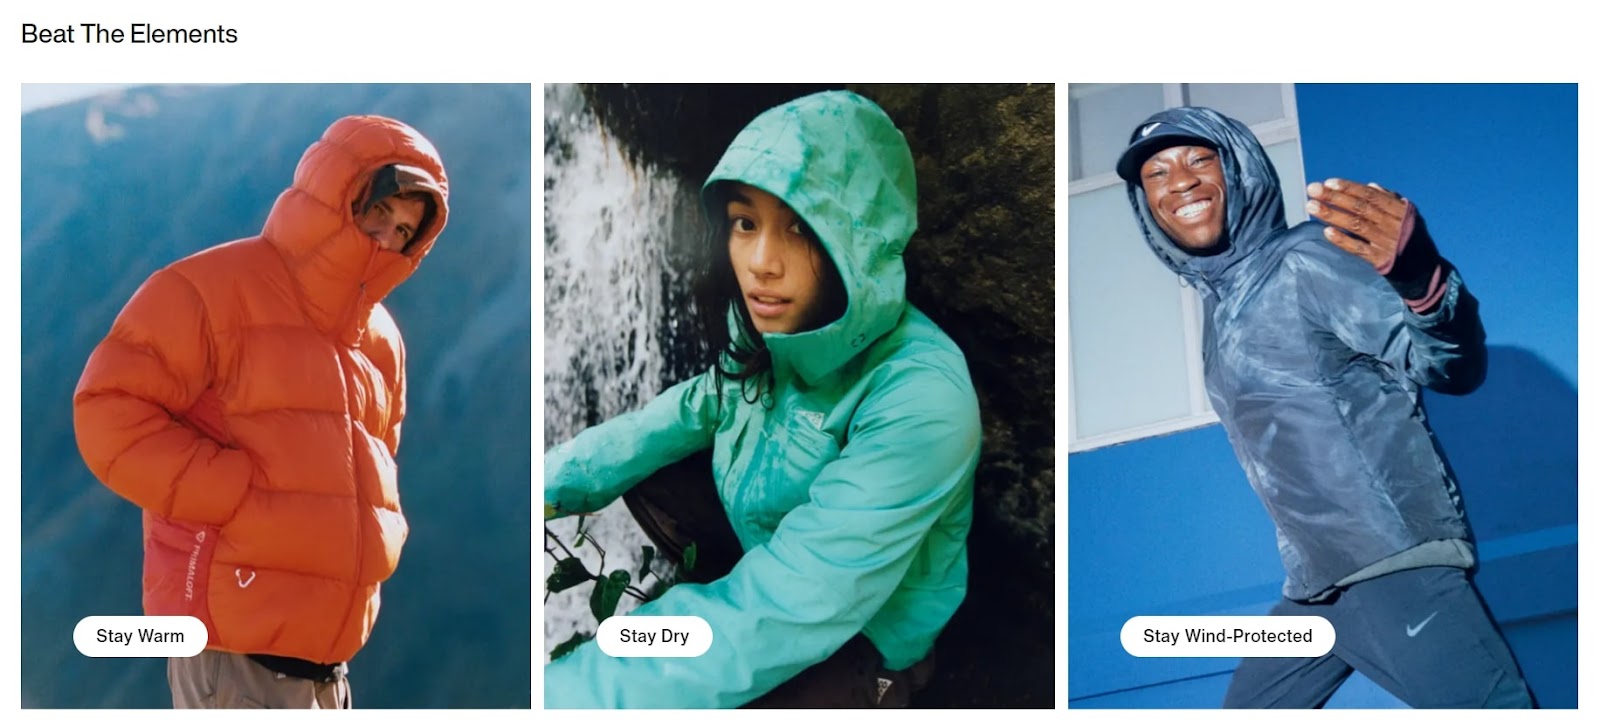
Compare that to their outerwear products page. Which feature imagery of people out hiking and walking. And has less emphasis on style. And more on functionality.
Create Your Own Psychographic Segmentations
Psychographic segments help you understand and connect with your audience. So you can sell more products and grow your business.
Semrush’s One2Target tool gives you immediate insights on your audience. And unlike focus groups, it doesn’t cost a fortune to access.
You can also get valuable data about key segments on X with the Audience Intelligence app.
Ready to discover more about the people buying your products? Try dozens of helpful marketing tools by signing up for a free Semrush account today.